
Understanding Twitter Page Analytics Without the Overwhelm
Diving into your Twitter page analytics can feel like trying to drink from a fire hose. You're faced with columns of numbers, winding graphs, and a stream of metrics that often create more confusion than clarity. But here's a secret that successful brands know: analytics aren't about drowning in data. They're about finding the story your audience is telling you through their actions.
The goal is to discover what your followers actually want, not just what you think they want. This simple shift in mindset turns data from a source of stress into your most useful guide for growth.
The key is learning to separate the important signals from all the surrounding noise. In a space where users produce over 500 million tweets daily, just adding to the chatter isn't a winning strategy. Your analytics are the feedback you need to make every tweet matter. Think of it as a huge opportunity to connect, but only if you're truly listening to what the data is saying.
Finding the Story in Your Data
Instead of getting hung up on every single number, start by looking for patterns. The best social media managers—the ones who scale accounts from a few hundred followers to hundreds of thousands—don't obsess over individual metrics. They focus on trends over time.
Ask yourself these questions as you look at your dashboard:
- Which content formats consistently get the most engagement?
- What topics spark real conversations in the replies?
- What time of day do my posts get the most attention?
These are the exact questions your Twitter page analytics are built to answer, showing you the habits and preferences of your unique audience.
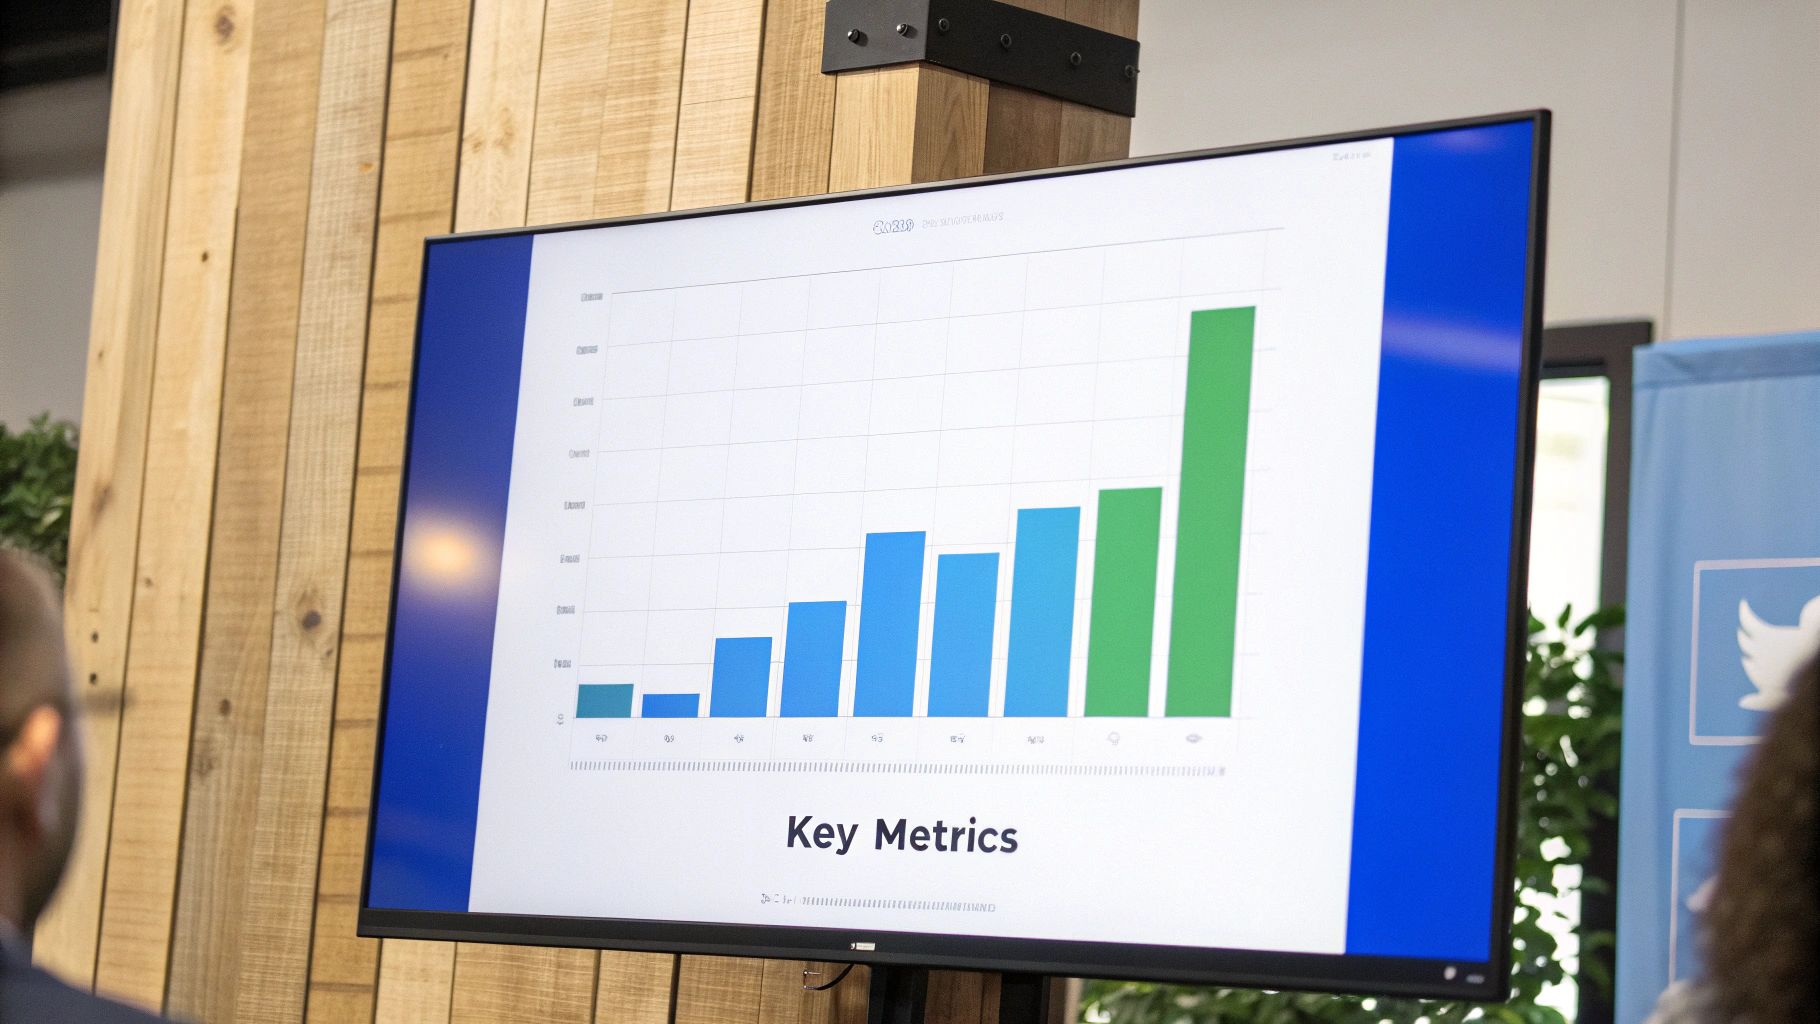
For example, here’s what a typical 28-day summary on your analytics dashboard might look like:

This top-level view quickly tells a story about your account's performance, highlighting changes in tweet impressions, profile visits, and follower counts.
Avoiding the Vanity Metric Trap
One of the most common mistakes brands make is chasing vanity metrics. These are numbers, like total impressions or follower count, that look impressive on paper but don't always signal real growth or business results.
Sure, a tweet getting thousands of impressions feels great, but it’s less meaningful if it leads to zero profile visits or link clicks. Real insight comes from focusing on metrics that show genuine audience interest, such as engagement rate, replies, and link clicks. These are the numbers that prove you’re not just being seen—you’re actually being heard.
Navigating Your Analytics Dashboard Like a Pro
Opening your Twitter analytics dashboard for the first time can feel like looking at the control panel of a spaceship—a sea of dials, graphs, and numbers. It’s not meant to be confusing; it’s a command center packed with insights to help you fine-tune your strategy once you know what everything does. The trick is to focus on what matters most.
Think of the main dashboard as your mission overview. It provides a high-level summary of your performance from the past 28 days, flagging your biggest successes and areas needing attention. This is your go-to spot for a quick health check of your account's performance.
The Account Home: Your Mission Control
Your journey into Twitter page analytics starts at the Account home. This is your default view, designed to give you a quick snapshot of your account's activity without overwhelming you with details.
Here’s a look at a typical Account home dashboard, which displays a 28-day summary of the most important metrics:
This snapshot tells a story at a glance, showing you the trends for core metrics like Tweet impressions, profile visits, mentions, and your follower count. It makes it simple to spot any significant changes, good or bad.
The ability to read a dashboard is a transferable skill. While this guide is about Twitter, the principles apply elsewhere. For example, knowing how to interpret Linktree's analytics dashboard to track clicks from your bio involves the same logic of connecting numbers to user behavior.
Key Sections of the Dashboard
To help you find exactly what you're looking for, the analytics dashboard is organized into several key sections. To give you a clear map, here’s a breakdown of what each area offers and how you can use it.
| Twitter Analytics Dashboard Sections Overview |
|---|
| A comprehensive breakdown of each analytics section and its primary use cases |
| Dashboard Section |
| Account Home |
| Tweet Activity |
| Audience Insights |
| Events |
This table shows that by regularly visiting each section, you can get a complete picture of your performance. You'll move from just posting content to making data-backed decisions that drive real growth.
Let's explore what each of these sections offers in more detail.
- Tweet activity: This is your deep-dive section for individual posts. It shows you everything from impressions and engagements to the overall engagement rate, helping you figure out why one tweet soared while another fell flat.
- Audience insights: When available, this section acts as a detailed profile of your followers. It can reveal demographics, interests, and even purchasing habits, giving you the information you need to tailor content directly to your audience. For more on this, our guide on using strategic replies shows how to turn these insights into follower growth.
- Events: This tab is a calendar of major global and regional events. It’s a fantastic resource for planning content that taps into current conversations and boosts your relevance.
By checking these sections regularly, you’ll start to see patterns. You'll learn which topics your audience loves, the best times to post for maximum reach, and how your activities directly contribute to follower growth. This is the difference between an account that grows and one that stagnates.
Metrics That Actually Drive Growth (And Which Ones Don't)
When you first dive into your Twitter page analytics, the sheer volume of numbers can feel overwhelming. It’s a common trap to focus on big, flashy figures like total followers or impressions and then wonder why your growth has stalled. The secret to a successful strategy lies in knowing which metrics signal genuine audience connection and which are just for show.
Think of it this way: impressions are the number of people who walk past your storefront. It's nice that they saw your sign, but it doesn't tell you if they were actually interested. Engagement rate, however, is like someone stopping, coming inside, and starting a conversation. This metric, which reveals the percentage of people who interacted with your tweet after seeing it, is a much stronger sign that your content is hitting the mark. On a platform where users spend a collective 7.8 billion minutes daily, capturing attention is key. To get a better sense of this active user base, you can explore detailed user statistics and peak engagement times on Analyzify's platform data page.
The Hierarchy of Engagement
It's also important to remember that not all engagements are created equal. A "like" is a quick, low-effort nod of approval, but it's often a passive gesture. Retweets and, more significantly, replies demand more from your audience. A reply means someone was so moved by your tweet that they stopped scrolling, thought of a response, and typed it out. That's a powerful indicator of a strong connection.
This infographic shows the relative value of different engagement types.
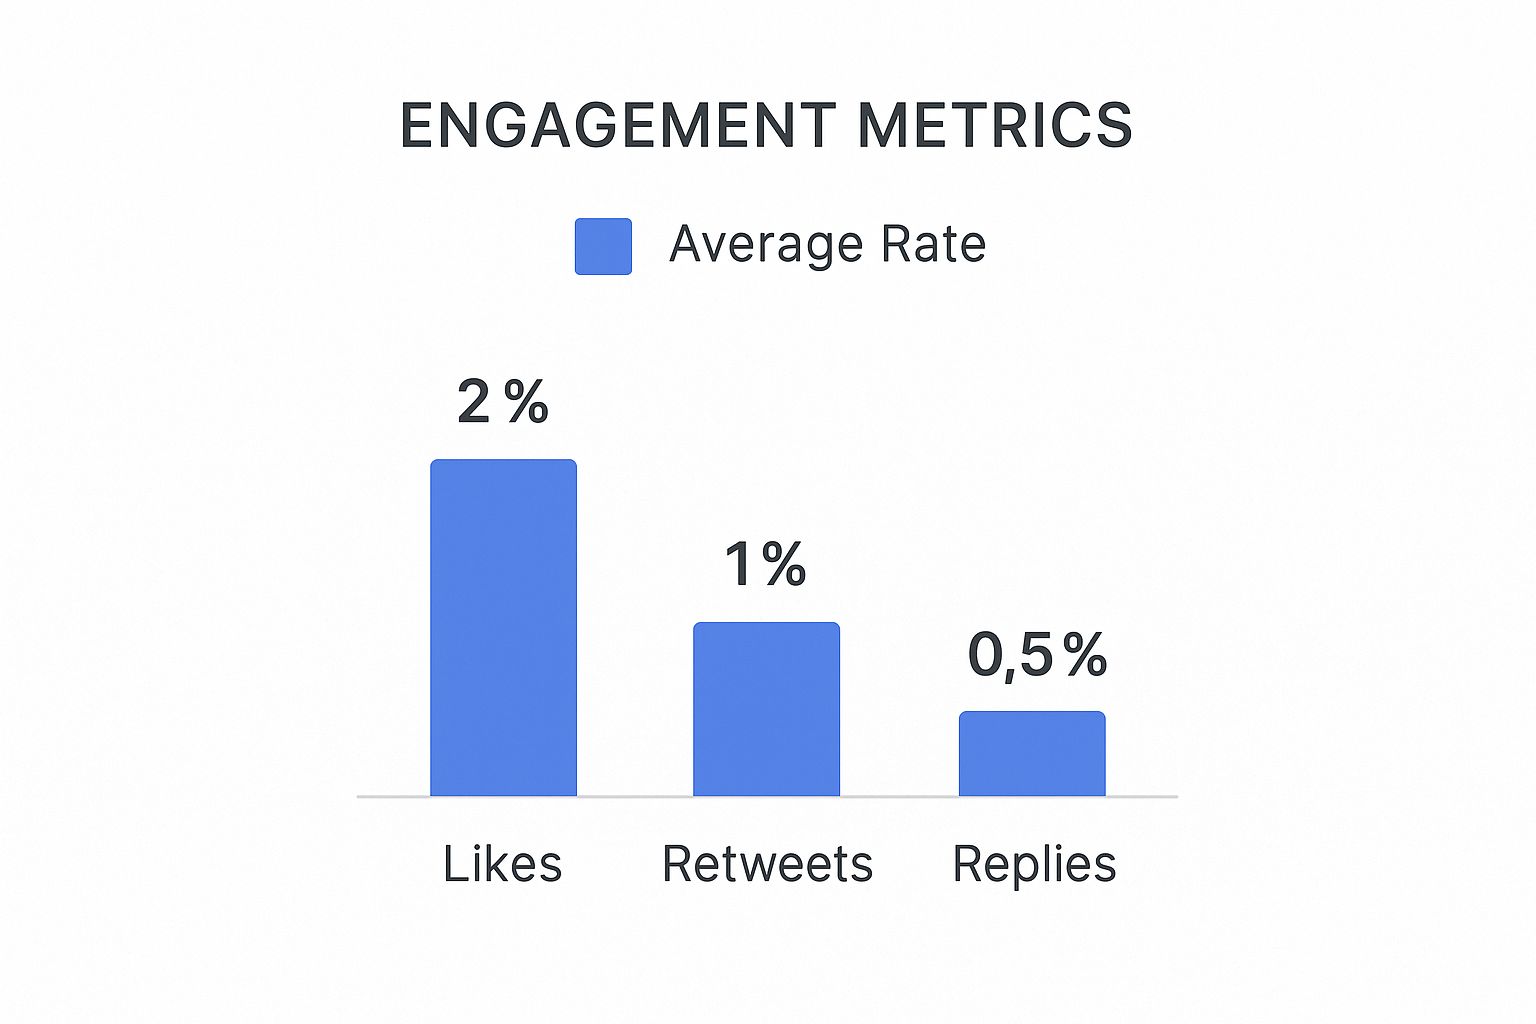
As you can see, replies might be the rarest form of interaction, but they are often the most valuable for building a real community around your brand.
Essential vs. Vanity Metrics Comparison
A side-by-side comparison of metrics that drive results versus those that just look good
| Metric Type | What It Measures | Business Impact | Action Required |
|---|---|---|---|
| Essential | Engagement Rate | Indicates how much your content resonates with the audience. | Analyze top-performing posts to identify successful content themes and formats. |
| Vanity | Impressions | The number of times a tweet was displayed on a user's timeline. | Use as a baseline, but don't treat it as a success metric on its own. |
| Essential | Link Clicks | The number of users who clicked a link in your tweet. | Directly measures your ability to drive traffic to your website, blog, or product pages. |
| Vanity | Follower Count | The total number of accounts following you. | Can be inflated by bots or inactive accounts; doesn't guarantee reach or engagement. |
| Essential | Replies | The number of direct responses to your tweet. | Fosters community and conversation, providing direct audience feedback. |
| Vanity | Likes | The number of users who liked your tweet. | A passive form of acknowledgment; less indicative of deep interest than other actions. |
Focusing on essential metrics like engagement rate and link clicks allows you to connect your Twitter activity to tangible business objectives, transforming your analytics from a simple report card into a strategic roadmap.
Metrics That Translate to Business Goals
Ultimately, the best Twitter page analytics strategies tie your social media efforts to real-world outcomes. This is where metrics like link clicks, profile visits, and conversion rates become your most important guides. They show you how effectively you're turning social media attention into website traffic, leads, or sales.
Here’s how to interpret what the numbers are telling you:
- High Engagement, Low Clicks? Your content is grabbing attention, but your call-to-action isn't strong enough. It might be time to revise how you ask your audience to act.
- High Impressions, Low Engagement? Your tweets are being seen, but they aren't sparking a reaction. Experiment with different topics, tones, or formats like polls and videos. For more help, our guide on understanding engagement metrics offers a detailed look at diagnosing these problems.
- High Clicks, Low Conversions? Your tweet is doing its job, but something on your landing page is causing friction. The issue might be with the page itself, not your Twitter strategy.
By prioritizing metrics that reflect deeper engagement and business-focused actions, you can move beyond surface-level stats. To sharpen your skills, you can discover expert tactics to boost your Twitter engagement rate and start converting passive viewers into an active, engaged community.
Reading Your Audience Like an Open Book
Your audience insights hold the key to creating content that truly connects, but most people only scratch the surface of what’s available. Think of this part of your Twitter page analytics not just as a data report, but as a detailed biography of your followers. It reveals not only who they are but also what motivates them to engage.
By digging into demographic and behavioral data, you can move beyond guesswork and start making informed decisions. For instance, knowing your audience is primarily active during evening hours in a specific time zone tells you exactly when to schedule your most important content. This is how you turn raw numbers into a real strategic advantage, adjusting everything from your content topics to your posting schedule for maximum impact.
From Demographics to Behavior Patterns
The real magic happens when you connect demographics with behavior. Your analytics might show you have a large following of tech professionals in North America. That’s a good starting point. But digging deeper might reveal they engage most with short, educational video clips posted on weekday mornings and are highly interested in AI and software development.
This level of detail allows you to build a content strategy that feels personal and relevant. It’s the difference between shouting into a crowd and having a direct conversation. On a platform with an advertising reach of about 586 million users worldwide, standing out requires speaking directly to your niche. This massive audience, representing about 7.1% of the global population over 13, is full of potential connections if you know how to find them. You can explore more interesting X statistics in DataReportal's latest overview.
Segmenting for Smarter Content
Once you identify these patterns, you can begin to segment your audience to create even more targeted content. Here are a few practical ways to do this:
- By Engagement: Group followers who frequently reply and retweet. These are your most valuable community members. Engage them directly and ask for their opinions.
- By Interest: If a large portion of your audience follows accounts related to a specific hobby, like gaming or photography, create content that speaks to that interest.
- By Influence: Your Twitter page analytics can help you spot followers with large followings of their own. Engaging with these accounts can create a powerful ripple effect, introducing your profile to entirely new audiences.
By reading your audience like this, you’ll not only find the best times to post but also predict which content formats and topics will perform best for your specific community.
Cracking the Code of High-Performing Content
Ever wonder why some of your tweets catch fire and spread across timelines, while others fizzle out with barely a ripple? The secret isn't random luck. It's about finding the right mix of elements, a formula you can uncover by digging into your Twitter page analytics. By carefully examining your most successful content, you can decode why certain posts resonated and create a repeatable strategy.
Think of your best-performing tweets as a blueprint. Your analytics dashboard is the tool that lets you inspect every part of that blueprint—from the exact time you posted to the specific words that sparked the most replies. The goal is to move past simply celebrating a one-off viral moment and start understanding the mechanics behind it. This reverse-engineering process is fundamental to building a content strategy that delivers consistent results.
The Anatomy of a Viral Tweet
Tweets that achieve massive reach and engagement rarely happen by chance. They are typically built on a foundation of smart formatting and psychological hooks that grab attention in a crowded feed. High-performing content usually shines in a few specific areas:
- Emotional Connection: The tweet strikes a chord, making people feel something strong like humor, surprise, or empathy.
- Shareable Value: It provides information that's helpful, entertaining, or makes the user look good for sharing it with their followers.
- Clear Visuals: Posts that include images or videos almost always see higher engagement. In fact, research shows that tweets with videos can attract ten times more engagement than those without.
- Strategic Formatting: Smart use of line breaks, emojis, and capitalization can make a tweet much easier to read and digest on a fast-scrolling timeline.
By comparing your top tweets against these points, you can start to see patterns. Perhaps you'll find that tweets asking a direct question get more replies, or that posts featuring data visualizations earn more retweets.
The Tweet activity dashboard is your starting point for this investigation.

This view gives you a detailed breakdown of a single tweet's performance, showing its impressions, total engagements, and even how many new followers it brought you.
Replicating Your Success
After identifying the key ingredients of your most popular content, the next step is to put those findings into practice. This doesn't mean you should copy your old tweets word-for-word. Instead, focus on the principles behind their success. If a specific tone of voice or content format consistently delivers great results, start weaving it into your content calendar more often. Our guide on how to see Twitter analytics offers more tips on finding and making sense of this data.
This approach is all about continuous testing and adjustment. Use your findings to form a hypothesis, such as, "Tweets that tell a personal story accompanied by a single, powerful image will achieve a higher engagement rate." Then, create new content to test that idea and use your Twitter page analytics to see if you were right. This data-backed method turns content creation from a guessing game into a calculated strategy for growth.
Advanced Strategies That Give You the Edge
Once you've gotten comfortable with your basic Twitter page analytics, it's time to find your competitive advantage. Most accounts stop at the surface-level metrics, but the real power comes from using advanced techniques to spot opportunities others miss. This means changing your thinking from just tracking performance to actively predicting trends and understanding your audience on a much deeper level.
Think of it as graduating from reading a paper map to using a GPS with live traffic updates. Basic analytics show you where you've been, while advanced strategies show you the best route forward, helping you avoid digital traffic jams.
Going Deeper with Your Data
One of the most effective but often overlooked techniques is cohort analysis. Instead of viewing your follower count as one giant number, cohort analysis groups followers who joined around the same time. By tracking these groups, you can see how their engagement evolves over weeks or months. This helps answer a vital question: "Are the followers I gained three months ago still interacting with my content today?" It’s the key to understanding if your content strategy is building long-term loyalty.
Another powerful strategy is sentiment analysis. This moves beyond simple likes and retweets to measure the emotional tone of replies and mentions. Are people responding with excitement, confusion, or frustration? Understanding this sentiment helps you monitor your brand's health and catch potential problems before they grow. It provides the "why" behind your engagement numbers. To really sharpen your skills, you can explore sophisticated testing methods. For instance, learning about multivariate testing for video creatives can show you which visual styles get the most positive reactions from your audience.
Integrating for a Complete Picture
Your Twitter page analytics become exponentially more powerful when you connect them with data from your other marketing activities. By linking tweet performance to your website traffic, lead generation, or sales figures, you can see the entire customer journey from start to finish.
- Competitor Benchmarking: Use third-party tools to check out your competitors' best-performing posts and audience demographics. This can highlight untapped markets and content gaps that you can fill.
- Custom Reporting: Create dashboards that show only the metrics tied to your specific business goals, like the cost per lead generated from a particular Twitter campaign.
- ROI Measurement: Connect your ad spending and content creation costs directly to revenue. This allows you to calculate the true return on investment of your Twitter efforts.
By blending these methods, you shift from simply reacting to data to proactively shaping your marketing results. You can find out more about which numbers matter most by reading our detailed guide to key Twitter performance metrics.
Your Analytics Action Plan for Real Results
Data without a clear purpose is just noise. The real value of your Twitter page analytics isn't in the numbers themselves, but in how you turn them into a concrete plan for growth. This is where you make insights actionable. Instead of getting lost in spreadsheets, you can create a simple, repeatable process for checking your performance and making smart adjustments to your content strategy.
This means shifting from passively looking at metrics to actively asking what they tell you to do next. A regular review process keeps you in tune with your performance without causing information overload. Successful accounts use their data to inform decisions on everything from posting frequency and content themes to audience development.
Establishing a Review Cadence
To avoid feeling overwhelmed, break down your analytics review into a manageable schedule. This ensures you’re consistently learning and adapting.
- Daily Check-In (5 minutes): Quickly scan for any unusual spikes in mentions or engagement on recent posts. Respond to replies to keep conversations alive.
- Weekly Review (30 minutes): Look at your top-performing tweet from the past week. What made it work? Was it the topic, format, or timing? Identify one key takeaway to apply to the upcoming week’s content.
- Monthly Deep Dive (1 hour): Analyze your overall trends. How did your follower growth and engagement rate change? Which content themes performed best? A great way to track this is by measuring your engagement rate over time. To make this easier, you can use our Twitter engagement rate calculator to see how you compare month-over-month. Use these broader insights to plan your content calendar for the next month.
From Data to Decisions
Your analytics should directly shape your content creation. If your data shows that tweets with videos get twice the engagement of text-only posts, your action is clear: start making more videos. If analytics reveal your audience is most active at 8 PM, schedule your most important announcements for that time.
This simple feedback loop—reviewing data, forming a hypothesis, testing it with new content, and measuring the results—is the foundation of a successful Twitter strategy. It transforms your Twitter page analytics from a historical record into a powerful tool for guiding your future growth.
Ready to stop guessing and start growing? Reply Guy is the Chrome extension that helps you find trending tweets in real-time, so you can join high-momentum conversations and convert impressions into followers. Engage smarter, not harder—get Reply Guy today and accelerate your audience growth.