
Decoding Twitter Performance Metrics Like a Pro
Think of your Twitter performance metrics as the dashboard in your car. Some gauges, like the speedometer (impressions) and the odometer (follower count), show you there’s activity. But it’s the fuel gauge and the engine warning light that tell you if you’re actually going to reach your destination. It's easy to get distracted by numbers that look impressive, but real success comes from understanding which metrics signal a healthy, growing account. A high follower count with zero engagement is like having a packed stadium with a silent crowd—it looks good, but there's no real impact.
The goal is to separate the meaningful signals from the surrounding noise. This means digging deeper than surface-level stats and focusing on the numbers that reflect a genuine connection with your audience. These core metrics generally fall into three categories: how many people see your content (Reach), how they interact with it (Engagement), and how your audience is growing (Follower Growth).
This infographic provides a simple breakdown of these core metric families.
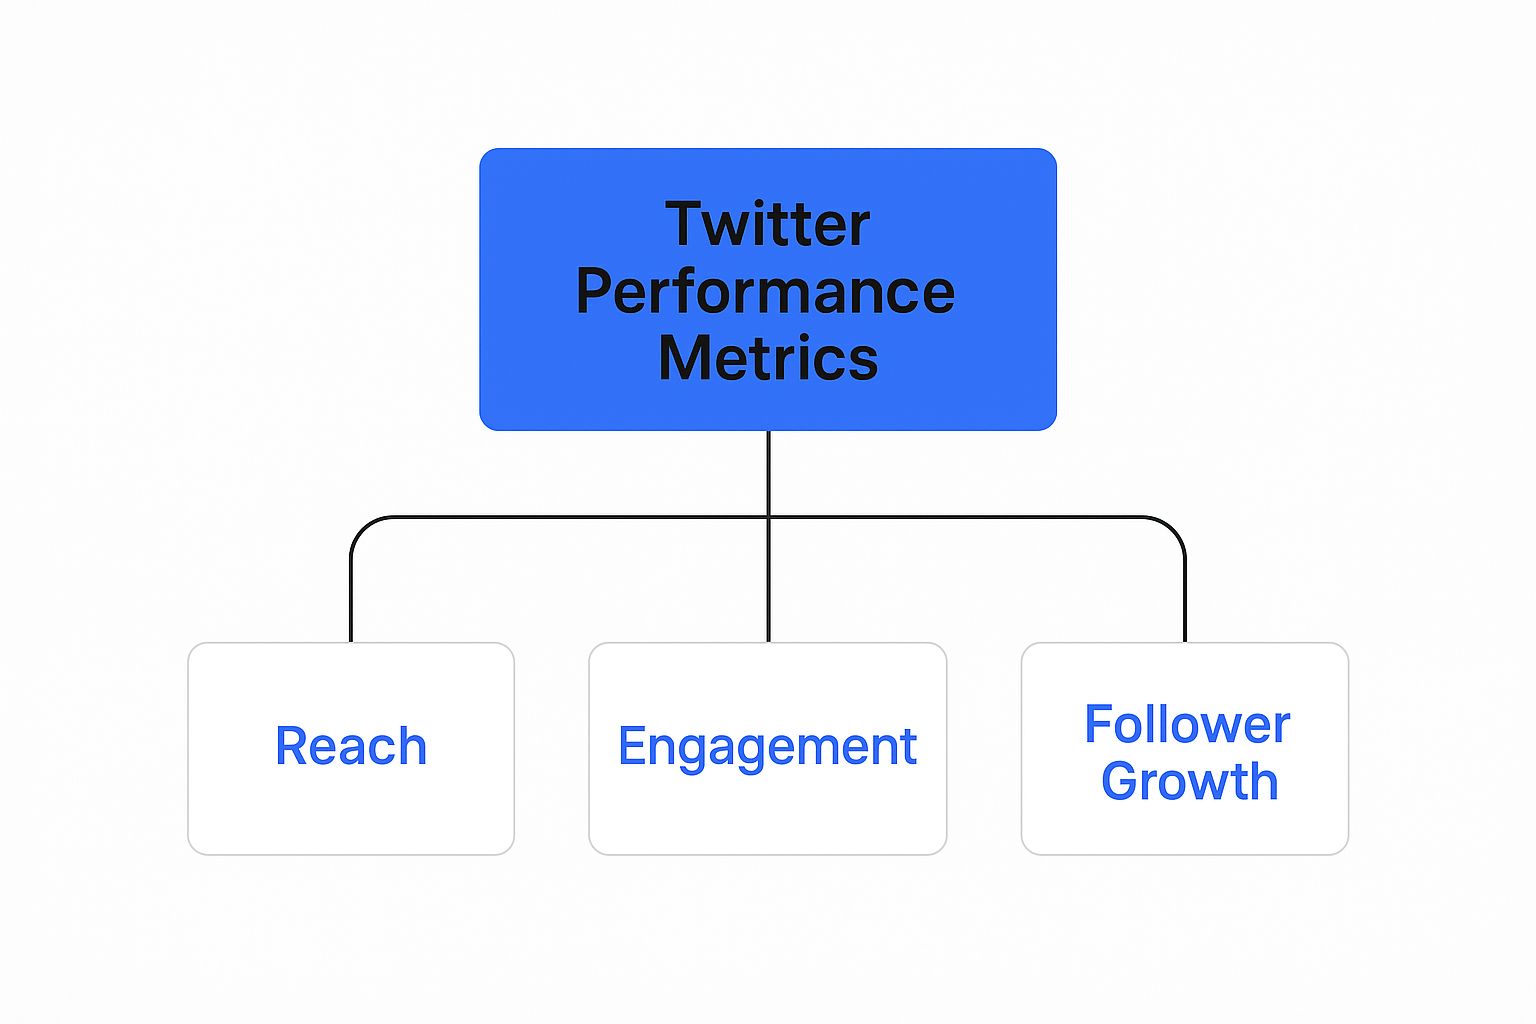
This visual shows how all performance is built on these three pillars, each telling a different part of your account's story. By understanding these categories, you can paint a more complete and useful picture of how you're doing. For a broader look at tracking success across different platforms, you can check out these essential social media key performance indicators.
Essential vs. Vanity Metrics
The first step in making sense of your analytics is learning to tell the difference between metrics that help your business and those that just flatter your ego. Vanity metrics are numbers like your total follower count or raw impressions. While they aren't completely useless, they can be deceptive. For example, a big jump in followers from a giveaway might not lead to a more engaged community.
On the other hand, essential metrics give you actionable insights. These include metrics like engagement rate, link clicks, and the quality of your followers. They tell you how people are reacting to your content, which is much more valuable than just knowing how many people saw it.
This difference is more important now than ever. The platform is seeing a resurgence, making it a key place for brands to connect with people. Twitter's monthly active users hit a record 541.56 million in 2023, a huge 47% increase from 2022. This growth opens up major opportunities for reach and engagement, but only if you focus on the metrics that count. You can explore more data on Twitter's recent growth at Famewall.io.
To help you prioritize, it's useful to compare vanity and essential metrics side-by-side. The table below outlines their key differences, showing you where to direct your attention for the best results.
Essential vs. Vanity Twitter Metrics Comparison A clear breakdown of which metrics drive real results versus those that just look impressive
| Metric Type | Business Impact | Actionability | Priority Level |
|---|---|---|---|
| Essential Metrics | Directly connects to audience loyalty, conversions, and brand health. Examples: Engagement Rate, Link Clicks, Reply Count. | High: Provides clear signals on what content works, helping you refine your strategy and make informed decisions. | High |
| Vanity Metrics | Indirectly related to brand awareness but can be inflated or misleading. Examples: Follower Count, Impressions, Video Views. | Low: Offers a general overview but gives little direction for specific improvements or content changes. | Low |
In short, while vanity metrics can give you a quick snapshot of visibility, essential metrics are what guide you toward meaningful growth and a stronger connection with your audience. Focusing on the latter is what separates good performance from great performance.
Engagement Metrics That Actually Drive Results
 While reach and impressions lay the groundwork for your visibility, engagement is the true pulse of your Twitter/X strategy. Think of it like this: impressions are the people who walk past your storefront, but engagement is the number who step inside, ask questions, and interact with your products. True influence isn't just about being seen; it's about being heard and starting valuable conversations.
The real skill is understanding what genuine interaction looks like. A "like" is a quick nod of approval, but a thoughtful reply is a conversation in the making. Both are engagements, but they have very different impacts. A post with 1,000 likes but only a handful of replies might be less valuable than one with 100 likes and 50 replies, because the second one shows a much deeper audience connection. To really understand Twitter performance metrics, you must learn to tell these interactions apart. You can explore this topic in more detail by reading this complete guide to understanding Twitter engagement metrics.
Breaking Down Key Engagement Metrics
To measure your impact, you need to examine the specific actions users take on your posts. Each action tells a unique story about how your content is performing. Let's break down the most important ones.
- Replies: This is the gold standard for engagement. A reply means someone was so moved by your tweet that they stopped, thought, and added their voice to the conversation. A high reply count suggests your content is thought-provoking and relevant.
- Retweets (and Quote Tweets): A retweet is an endorsement. When someone retweets your post, they are putting their stamp of approval on it for their own followers to see. This action extends your reach to new, interested audiences who already trust the person sharing.
- Likes: While a more passive form of engagement, likes are still a valuable signal. They act as a quick poll, showing you at a glance which content themes, formats, and tones your audience enjoys.
- Link Clicks: If your primary goal is to drive traffic to a blog, product page, or website, this is your most critical engagement metric. It proves your tweet was persuasive enough to make someone leave the platform and explore further.
To help you put these metrics into perspective, here is a breakdown of what each one means for your account and how you can work to improve them.
Twitter Engagement Metrics Breakdown
Detailed analysis of different engagement types and their significance for various account goals
| Engagement Type | What It Measures | Good Benchmark | Improvement Strategies |
|---|---|---|---|
| Replies | The level of conversation and community your content inspires. | >1% of engagements | Ask open-ended questions. Post controversial (but on-brand) opinions. Actively reply to comments to encourage more. |
| Retweets/Quote Tweets | The content's appeal and share-worthiness; how much users want to endorse you. | Varies by industry; >0.5% of impressions is strong. | Post highly visual content (infographics, videos), share surprising stats, or create content that helps your audience. |
| Likes | General audience approval and resonance with a topic, tone, or format. | The most common engagement; aim for >1% of impressions. | Analyze top-performing "liked" tweets to identify popular content themes. Use strong visuals and clear messaging. |
| Link Clicks | The effectiveness of your call-to-action (CTA) and your ability to drive traffic. | >1.5-2.5% of impressions (CTR) | Write compelling copy that creates curiosity. Use clear CTAs like "Read more" or "Shop now." Shorten links for a cleaner look. |
Ultimately, focusing on the right mix of these engagement types will depend on your specific goals, whether that's building a community, generating leads, or increasing brand awareness.
Calculating Your True Engagement Rate
Your overall engagement rate is the most dependable way to benchmark your performance. It puts your interactions into context by measuring them against your impressions, revealing how compelling your content is relative to its visibility. The standard formula is:
(Total Engagements ÷ Total Impressions) x 100 = Engagement Rate
For instance, if a tweet receives 10,000 impressions and 250 total engagements (a mix of likes, replies, retweets, etc.), your engagement rate is 2.5%. This single percentage is a powerful indicator of content quality. Keeping a consistent flow of fresh content is crucial for driving results; you can find inspiration by checking out these effective social media post ideas. With Twitter/X surpassing 500 million monthly active users in 2024, the opportunity to connect is massive. You can learn more about Twitter's user growth on Backlinko.com.
Understanding Reach and Impression Dynamics
Imagine your Twitter performance metrics are telling a story. Engagement shows you how exciting the plot is, but reach and impressions are the very first chapter—they decide how many people even start reading. While people often use these terms interchangeably, they describe different parts of your story's beginning. Impressions are the total number of times a tweet is displayed. If one person sees your tweet, and then sees it again after a friend retweets it, that's two impressions.
Reach, however, is the number of unique people who see your tweet. It measures the total size of your audience. While Twitter/X doesn't give you a direct reach number, impressions are a fantastic stand-in for measuring your content's visibility. A big jump in impressions is a clear signal that your tweet is catching on with the algorithm and traveling beyond your immediate followers. It's the first clue that your content might be on its way to something big.
Why Impressions Matter More Than You Think
Impressions are the bedrock for every other action on Twitter. You can't get likes, replies, or clicks without them. It’s a straightforward but vital idea: people can't engage with content they never see. A consistent rise in your impression count points to a healthy content strategy. It means you're regularly appearing in front of the right audience, which builds brand awareness and solidifies your position as a credible voice in your space.
But not all impressions are the same. The velocity of your impressions—how fast you get them—can be more telling than the final number, especially for timely topics. A tweet that racks up 10,000 impressions in its first hour has a much better shot at going viral than one that takes a full week to get there. High impression velocity tells the algorithm your content is relevant right now, which can lead to even more of a push. This is where smart timing and using the right hashtags become so important. To learn more about fanning these flames, check out our guide on how to increase Twitter engagement, since more engagement is what fuels your impression engine.
Organic vs. Algorithmic Amplification
Your impressions flow from two primary sources: your existing followers and the platform's algorithm.
- Organic Impressions: These come from the people who already follow you and see your content in their "Following" feed. This is your baseline visibility, built on the community you've already nurtured.
- Algorithmic Impressions: This is when the algorithm decides to show your tweet to non-followers. It can appear on their "For You" page, in search results, or under trending topics. This is where explosive growth is born.
The secret to achieving massive visibility is to create content that bridges this divide. When a tweet gets a lot of engagement from your organic followers, it sends a powerful message to the algorithm that it's quality content worth sharing more widely. This kicks off a positive feedback loop: more engagement leads to more algorithmic impressions, which brings in a new audience that can engage further. Mastering these dynamics is the key to expanding your influence far beyond your current follower count.
Building Quality Followers Who Actually Care
After impressions and engagement, the third pillar of a strong X (formerly Twitter) presence is follower growth, but with a major twist. The old game of collecting followers like baseball cards is over. Today, the smartest accounts recognize that 100 engaged followers who truly connect with their content are more powerful than 10,000 silent ones who just scroll by. This mindset shift from quantity to quality is key to understanding your real impact.
Think of your follower list as a community, not an audience. A massive but quiet following doesn’t spread your message, offer useful feedback, or turn into loyal customers. A smaller, dedicated community, on the other hand, will jump into conversations, share your posts with their circles, and build the social proof that attracts more of the right people. This is the foundation of real, organic growth. The objective isn't just to increase a number; it's to build a base of genuine advocates.
Auditing Your Audience Quality
Before you can attract the right people, you need to know who’s already listening. A quick follower audit can tell you a lot about the health of your account. A good place to start is by comparing your follower count to your engagement. If you have a huge following but your posts are met with silence, it’s a sign your audience may include inactive accounts or people outside your niche.
To get a clearer picture, take these steps:
- Analyze Engagement Patterns: Take a look at your most active followers. What do they share in common? Do they work in your target industry or match your ideal customer profile?
- Check Follower Demographics: Use the native X Analytics to review the interests, locations, and other demographic details of your audience. Does this profile align with the audience you want to reach?
- Identify Your Advocates: Pinpoint the users who consistently reply to or share your content. These individuals are the heart of your community. Focusing on these relationships is essential for building a stronger following.
Strategies for Sustainable Growth
Once you understand your current audience, you can sharpen your strategy to attract more people just like them. Sustainable growth is built on consistency and value, not on shortcuts. Steer clear of tactics like follow-for-follow schemes that only puff up your numbers with disengaged accounts. Instead, concentrate on delivering value that naturally draws in the right crowd. We delved into this principle with experts in our guide on growing your Twitter following with Reply Guy.
The platform's worldwide presence creates a massive opportunity to connect with a varied and active user base. The United States leads with over 106 million users, but there are also large communities in Japan and India, with around 69.3 million and 25.5 million users, respectively. You can dive deeper into these figures by exploring global Twitter usage data. This global scale highlights why having a clear content strategy is so important—it helps you attract quality followers from a huge pool of potential connections.
Tracking Clicks and Conversions That Matter
While engagement and follower growth are important, they are really just setting the stage for the main event: turning your social media presence into real business results. This is where Twitter performance metrics show their true value by connecting directly to your bottom line. Think of your X account as a lively town square. People show up (impressions), have conversations (engagement), and decide they like the vibe enough to stay (followers). But the ultimate goal is to guide them from that square into your shop. Clicks and conversions are the signposts that measure this crucial final step.
Many accounts miss this part, celebrating a flood of likes but failing to turn that attention into anything substantial. A winning strategy builds a clear bridge from a tweet to an action. This isn't just about dropping a link; it's about crafting compelling calls-to-action (CTAs) that feel natural in the fast-paced flow of X while being persuasive enough to make someone click. Since over 35% of users use the platform to research brands, giving them a clear next step when their interest is high is essential.
From Link Clicks to Meaningful Actions
The first step on this path is the link click. This metric is your initial signal that a CTA has landed correctly. It tells you that your tweet not only caught someone's eye but was also intriguing enough to make them want to know more. While X Analytics gives you this basic number, the real story unfolds after the click. Are users just landing on your page and bouncing, or are they signing up for a newsletter, downloading a guide, or making a purchase?
To connect these dots, you need to move beyond X's built-in analytics and set up proper conversion tracking. This means using a few key tools to see the entire user journey.
- UTM Parameters: Think of these as little tracking tags you add to your URLs. They tell your analytics platform, like Google Analytics, exactly which tweet sent you the traffic, helping you separate clicks from different campaigns.
- Dedicated Landing Pages: Creating unique landing pages for your X campaigns allows you to match the message from your tweet and precisely track conversions from that specific source.
- The X Pixel: If you're running ads, installing the X (Twitter) Pixel on your website is a must. It tracks the actions users take after seeing your ads, from viewing a product page to completing a checkout.
Setting up this kind of tracking creates a complete funnel, showing you how people move from a single tweet to a conversion. This data is priceless for refining your strategy. To get a better handle on the first part of this funnel, our Twitter engagement rate calculator can help you see how well you're grabbing that initial attention.
Mapping Your Twitter Conversion Funnel
Creating a system to measure this journey is fundamental to proving your account’s business value. The table below breaks down the key stages, metrics, and methods for tracking the path from a tweet to a tangible business outcome.
Here’s a step-by-step breakdown of how to track the user journey from Twitter to a conversion.
| Funnel Stage | Key Metrics | Tracking Method | Optimization Tips |
|---|---|---|---|
| Awareness | Impressions, Link Clicks, Click-Through Rate (CTR) | X Analytics, URL Shorteners | Write compelling copy that sparks curiosity. Use strong visuals and clear, direct CTAs. |
| Consideration | Landing Page Views, Time on Page, Bounce Rate | Google Analytics (with UTMs) | Make sure your landing page is mobile-friendly and delivers on the promise made in your tweet. |
| Conversion | Sign-ups, Downloads, Sales | Google Analytics Goals, X Pixel | Keep your conversion action simple. Remove any unnecessary fields from your forms to reduce friction. |
| Retention | Repeat Visits, Customer Lifetime Value (CLV) | CRM, E-commerce Platforms | Follow up with converted users through email or retargeting ads to build a lasting relationship. |
By tracking metrics at each stage of this funnel, you move from simply counting likes to demonstrating how your X activity directly contributes to business growth.
Advanced Analytics: Reading Between the Lines

Moving beyond simple counts of likes and clicks is where you start to understand what your audience truly thinks and feels about your brand. This deeper layer of Twitter performance metrics shifts from basic arithmetic to the art of interpretation. This is where you find a real competitive edge. Think of yourself as a detective: basic metrics are your initial clues, but advanced analytics is how you piece them together to solve the case. It’s about spotting opportunities and risks in the nuances of conversation before they become obvious to everyone.
One of the most effective tools in this detective kit is social listening. The most successful brands don't just react to their own mentions; they proactively tune into the entire conversation within their niche. This helps them identify emerging trends, monitor competitor moves, and find potential influencer partnerships that are a genuine match for their brand voice, not just their follower numbers.
Understanding Sentiment and Share of Voice
At the heart of this deeper analysis is sentiment. This isn't just a simple positive-versus-negative score. It’s about recognizing the subtle emotional tone of online discussions. For example, a sudden increase in neutral-toned mentions could signal curiosity about a new product. In contrast, a gradual shift from positive to sarcastic comments could be an early warning of growing customer frustration. While tracking sentiment manually can be tough, it adds invaluable context to your data. You can learn more about applying these ideas by exploring our guide on using a Twitter analytics account.
Another critical metric is Share of Voice (SoV). This tells you how much of the conversation in your industry is about your brand compared to your competitors. Essentially, it’s your conversational market share.
Here’s how you can calculate it:
- Track all mentions of your brand.
- Track mentions of your key competitors.
- Divide your brand mentions by the total industry mentions (your mentions + your competitors' mentions).
For instance, if your brand was mentioned 200 times in a week, and your two main competitors were mentioned 300 and 500 times, your SoV would be 20% (200 / 1000). A rising SoV shows that you're becoming a more significant voice in your field. Despite a study suggesting a 30% drop in overall platform usage from 2023 to 2024, the users who remain are highly engaged, making a strong SoV more meaningful than ever.
By keeping an eye on these advanced metrics, you can stop merely reacting to your timeline and start actively shaping the conversation. This proactive approach allows you to anticipate audience needs, respond to competitor actions, and build a resilient brand presence that truly stands out.
Tools and Systems That Actually Work
Understanding your Twitter performance metrics is one thing, but consistently acting on them requires a solid system. Theory is great for conversation, but without a practical way to apply it, your insights won't lead to growth. To turn data into measurable improvements, you need the right tools and a structured process. This is how you transform raw numbers into a week-over-week strategy that works.
Your Essential Analytics Toolkit
Your analytics toolkit doesn't need to be overwhelmingly complex, but it must be effective. The right tools help automate reporting, save you from hours of manual work, and surface the insights that actually guide your decisions. Think of it as upgrading from a paper map to a GPS; both show you the way, but one gives you real-time feedback and gets you there much faster. Your journey begins with what the platform itself offers.
- Native X (Twitter) Analytics: This should always be your first stop. It’s free, built-in, and provides a reliable overview of your core metrics like impressions, engagement rates, and link clicks. It’s perfect for a quick health check on your account and seeing how individual tweets are performing.
- Third-Party Analytics Platforms: For a deeper dive, tools like Keyhole or Sprout Social are incredibly helpful. They offer advanced features like sentiment analysis, tracking your share of voice against competitors, and detailed hashtag performance reports. These platforms are where you go to answer the complex "why" questions behind your data.
- Scheduling and Content Management Tools: To manage and optimize your Twitter presence efficiently, it's smart to use the right top social media content creation tools. Platforms like Buffer or Hootsuite not only help you plan content but also provide their own analytics, often presenting data in a more user-friendly way than native tools.
Building Your Performance Dashboard
The native X Analytics dashboard gives you a high-level view of your account’s recent performance.
This 28-day summary is a snapshot of your key trends, showing whether your tweets, impressions, and profile visits are moving up or down. It's the mission control for your basic Twitter performance metrics, allowing you to spot significant changes at a glance.
The key to an effective system is establishing a regular review schedule. A weekly check-in keeps you agile, allowing you to double down on what’s working and quickly pivot away from what isn’t. Pair this with a more thorough monthly review where you analyze longer-term trends and adjust your overall strategy. This structured approach stops you from getting lost in daily noise and keeps you focused on consistent, sustainable growth.
By integrating these tools into a regular review process, you create a powerful feedback loop. You post content, measure its performance with the right tools, find actionable insights, and use those insights to create even better content. This systematic approach is what separates accounts that stagnate from those that achieve continuous success over time.
For creators looking to speed up this process, focusing on high-momentum conversations is a game-changer. Reply Guy helps you find trending tweets in real-time, allowing you to engage where the visibility is highest. Instead of just analyzing past performance, you can actively place yourself in the middle of current opportunities. Discover how Reply Guy can transform your engagement strategy and fuel your growth today.