
Finding Your Analytics Dashboard Without The Runaround
Let's be real, finding your analytics on X (formerly Twitter) can be a wild goose chase. The interface changes so often, it's like they're trying to keep us on our toes! I've been there, trust me. Whether you're confused by the rebrand or just trying to navigate the mobile version, accessing those key insights can be a pain.
One trick I've learned is to bookmark analytics.twitter.com. Seriously, it's a lifesaver. This direct link usually bypasses all the X/Twitter madness and takes you straight to your data. This is especially useful if you're juggling multiple accounts. And by the way, business accounts tend to have a much smoother analytics experience than personal accounts. Just another one of those little quirks.
Twitter Analytics, launched back in 2014, is a powerful tool for tracking how your tweets are performing and how people are engaging with your account overall. To get there, log into your Twitter account on your desktop and go directly to analytics.twitter.com, or click "More" and then "Analytics" in the menu. You can discover more insights here. For measuring your Twitter impact, this is a handy resource: Twitter. Even for seasoned users, that "More" menu has a habit of disappearing – a common source of frustration, I know.
I’ve even heard of some agencies, who manage tons of client accounts, creating a spreadsheet with direct links to each client's analytics dashboard. It's a simple organizational trick, but it can save you a ton of time and headaches. It lets you quickly see how each profile is performing, without having to dig around.
Reading Your Dashboard Like A Social Media Detective
Your Twitter (X) analytics dashboard is a goldmine of information, but it's easy to get lost in the numbers. Instead of just glancing at vanity metrics, let's dive in and decode what those numbers really mean about your audience. Think of it like detective work – uncovering the clues to better engagement.
This dashboard is packed with stats: impressions, profile visits, mentions, follower growth… the works. For example, the 'Tweet Activity' tab shows you key metrics like impressions (how many times a tweet was seen), engagements (total interactions – likes, retweets, replies), and the all-important engagement rate (engagements divided by impressions). This rate, not just raw impressions, tells you if your content is actually resonating. Want a deeper dive into engagement? Check out this helpful guide: Twitter analytics and understanding engagement metrics.
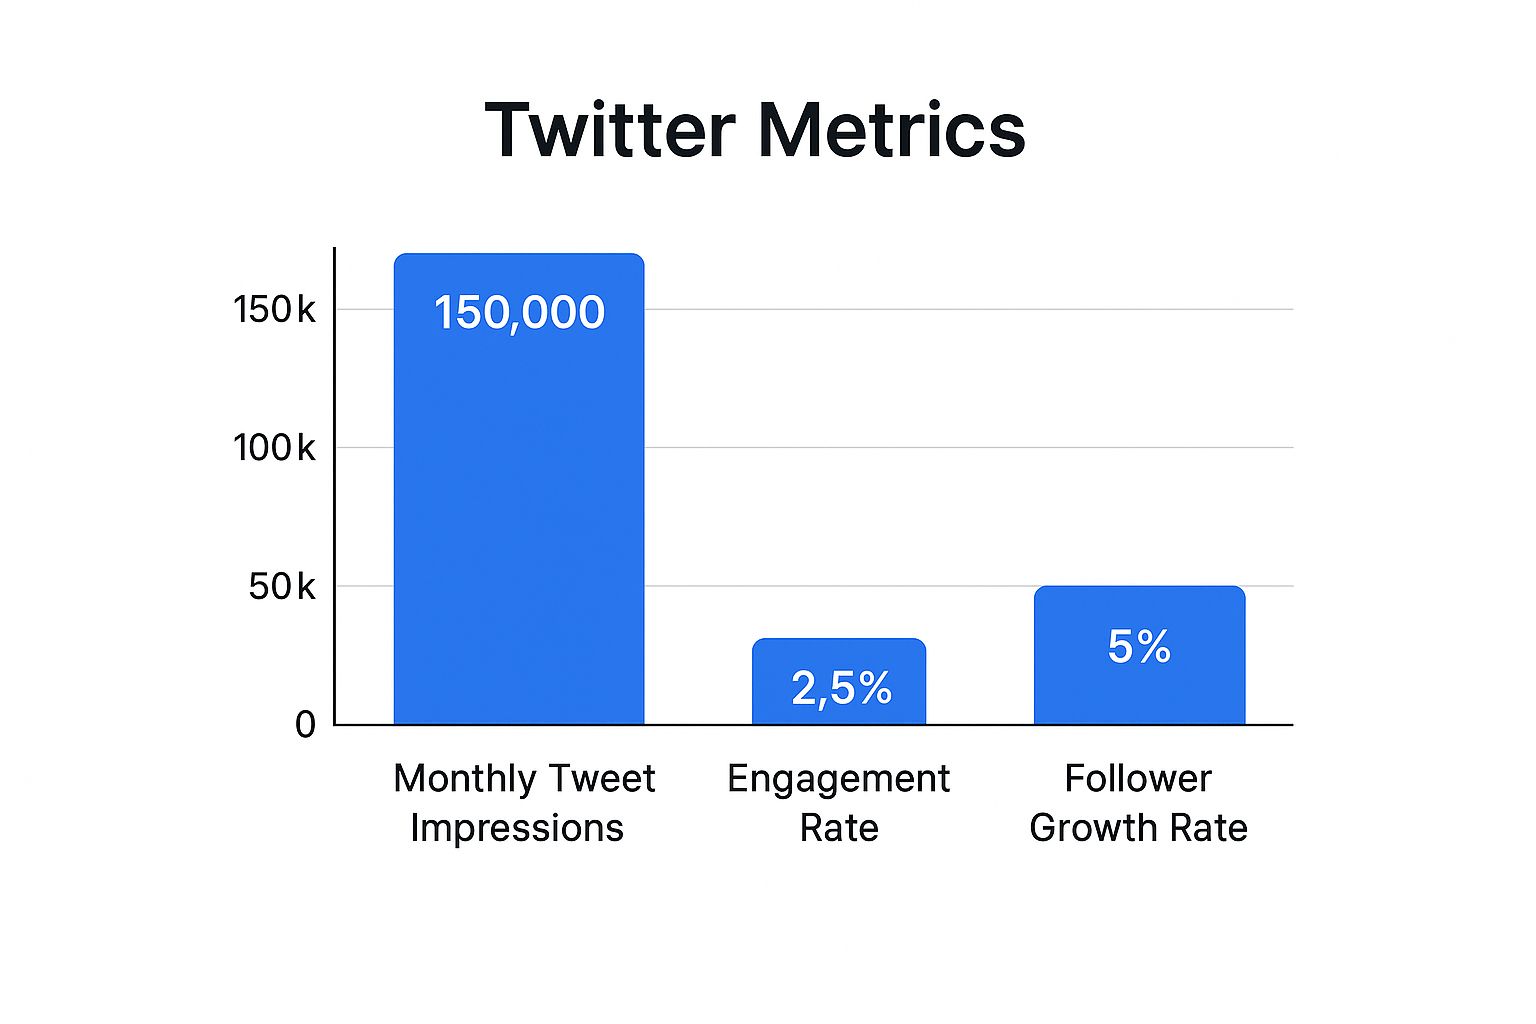
The infographic above shows some sample data – monthly tweet impressions, engagement rate, and follower growth rate. Notice something interesting? Even with 150,000 impressions, a low engagement rate of 2.5% suggests that while people saw the tweets, they didn’t really connect. Combine that with a 5% follower growth rate, and it’s a clear sign: there’s room to improve by creating content that sparks conversations.
Understanding Your Metrics
Once you've located your Twitter analytics dashboard (learn more about Twitter User data here), take a look at how your numbers stack up. Setting up a comprehensive social media analytics dashboard can give you a broader perspective.
Don’t get caught up in chasing huge impression numbers. Instead, look for the combination of metrics that indicates real growth. It's about fostering a community, not just broadcasting to the void.
Here’s a handy table to break down some key metrics:
Key Twitter Analytics Metrics Explained A comprehensive breakdown of essential metrics and their practical significance for content strategy
| Metric | Definition | Why It Matters | Benchmark Range |
|---|---|---|---|
| Impressions | Number of times a tweet was displayed | Shows potential reach, but not necessarily engagement | Varies widely based on audience size and content |
| Engagement Rate | Ratio of engagements to impressions | Measures how effectively your content drives interaction | Aim for above industry average; track trends over time |
| Follower Growth Rate | Percentage increase in followers over a period | Indicates how quickly your audience is expanding | A steady, positive growth rate is a good sign |
| Profile Visits | Number of times users viewed your profile | Shows interest in your brand/persona | Can indicate potential for conversions |
| Mentions | Number of times your @username was mentioned | Measures brand awareness and conversation volume | Track mentions to identify trends and sentiment |
This table summarizes the key metrics you should be tracking. Notice how each one tells a different part of the story. Impressions are great, but engagement is king. And a growing follower count is a good indicator that you’re building a loyal audience.
Remember, building a strong Twitter presence isn't about how many people see your tweets, but how many people care about what you're saying. Understanding this allows you to refine your strategy and create tweets that resonate on a deeper level.
Uncovering What Your Audience Really Wants
Twitter (X) analytics. It’s not just about numbers, it's about understanding what makes your audience tick. It's about transforming data into content gold. Forget simply seeing when they're online; the real magic is discovering what makes them stop scrolling. Savvy creators use analytics to understand what their audience truly craves—what gets a few casual likes versus what sparks genuine engagement and profile visits. You need to understand what resonates to truly refine your approach. Tracking content performance is key to this. track content performance
Let’s say you’re a food blogger. Imagine noticing your tweets with vibrant, high-quality food pics get way more engagement than text-only tweets. Bingo! Your audience is visually driven. If tweets linking to your detailed recipe blogs outperform quick video tutorial links, you know they value in-depth content. These insights are gold for planning future content.

Consider this: 10% of U.S. Twitter users create 92% of the tweets. That's a concentrated group! these statistics. Twitter Analytics is critical for understanding user behavior within this dynamic. Tracking what performs best among these high-activity users gives you a real competitive edge. It underscores why identifying your most engaged audience segment is so important—they're the ones driving the conversation. Need to grow your Twitter following? Check out this growth guide: Our Twitter growth guide.
High impressions aren’t everything. A funny or controversial tweet might go viral, racking up tons of impressions. But if it doesn't lead to profile visits, follows, or website clicks, it's not really helping you reach your goals. Real engagement—replies, retweets, quote tweets—signals a deeper connection. This boosts your visibility within the algorithm and builds a community. That's what creates a loyal audience.
Spotting Growth Patterns That Actually Predict Success
Looking at your Twitter (or X as it's now known) analytics day-to-day can feel like a rollercoaster. One day you're riding high, the next you're down in the dumps. But the real magic happens when you zoom out and look at the bigger picture. This is where you find the long-term trends that tell the real story of your growth. It's like investing – you're looking for long-term gains, not just a quick buck.
Think of it this way: imagine a tech blogger who gets a huge spike in engagement because they happened to tweet about a trending topic. Awesome! But the real question is, can they keep that momentum going? By digging into their historical data, they can see if that spike was a fluke or part of a larger upward trend. If they consistently see strong engagement on tech-related posts, that’s the golden ticket – a pattern they can build a whole strategy around.

Analyzing long-term trends can also reveal hidden opportunities, like seasonal patterns. For example, a food blogger might see a surge in engagement around Thanksgiving. Recognizing this allows them to plan themed content and recipes ahead of time, capitalizing on that predictable spike in interest. This is where knowing your audience and their behavior really pays off. Want to learn more about engagement rates? Check out this article: What is a good Twitter engagement rate?
On the flip side, a long-term view can also give you a heads-up about potential problems, like audience fatigue. If engagement starts to dwindle, even though you're posting regularly, it might be time to shake things up. Maybe your audience is bored with the same old content, or maybe you're tweeting too much.
It’s interesting to see how Twitter Analytics has grown alongside the platform itself. Back in 2024, Twitter had a whopping 611 million monthly active users, making it the 12th most popular social network globally. That’s a lot of competition! Discover more insights. Understanding your analytics is key to standing out from the crowd.
Believe it or not, long-term trend analysis can even give you insights into your competitors. Let’s say you notice a dip in your engagement on a specific topic. It could be because a competitor is stealing the show. This is your cue to check out what they’re doing and see if you can learn a thing or two. Everyone experiences ups and downs on social media. It's totally normal. But by understanding your long-term trends, you can figure out what's causing those dips, bounce back faster, and build a more sustainable following.
To help you stay on top of your long-term performance, I've put together a simple tracking template:
Monthly Performance Tracking Template
Essential metrics to monitor monthly for sustained Twitter growth and engagement optimization
| Metric | Current Month | Previous Month | % Change | Action Required |
|---|---|---|---|---|
| Followers | 5500 | 5000 | +10% | Continue current strategy |
| Impressions | 50,000 | 40,000 | +25% | Analyze top performing tweets |
| Engagement Rate | 2% | 1.5% | +33% | Experiment with new content formats |
| Link Clicks | 100 | 80 | +25% | Promote high-value content more actively |
| Profile Visits | 200 | 150 | +33% | Optimize profile bio and pinned tweet |
This table helps you visualize your progress and identify areas for improvement. By tracking these key metrics month over month, you can spot emerging trends, catch potential issues early, and make data-driven decisions to optimize your Twitter strategy. Remember, consistency is key! Regularly reviewing your performance is crucial for long-term success on Twitter.
Transforming Data Into Content That Connects
So, you’ve figured out how to access your Twitter (also known as X) analytics and how to understand what those metrics are telling you. Awesome! Now comes the really fun part: turning that data into content that genuinely connects with your audience. It’s where analytics becomes art—finding that sweet spot between data-driven decisions and maintaining your authentic voice. I’ve chatted with lots of creators who've nailed this, and they all agree on one key thing: know your audience.
Let’s say, for example, your analytics show a huge spike in engagement whenever you tweet about sustainable living. That’s a big, flashing sign! Now, don't just post that exact same tweet again and again. Instead, think about related areas – ethical fashion, zero-waste living, eco-friendly travel. This keeps your content fresh while still giving your audience what they clearly love. You're expanding your content universe without being repetitive.
Think beyond just topic, too. Maybe your data shows that video content performs incredibly well. Play around with different video formats – quick tips, behind-the-scenes peeks, interviews with experts. It’s all about using the data as inspiration for creative exploration, not a rigid formula. You could even compare your Twitter data with other social platforms like Instagram or Facebook. You can find some helpful insights on analyzing other Twitter accounts here: Check out our guide on analyzing Twitter accounts.
Avoiding the Data Trap
It’s surprisingly easy to get caught up in the numbers game. I’ve seen creators obsess over optimizing for very specific metrics and completely lose their unique voice in the process. Data-backed content can fall flat if it feels forced or fake. Remember, your audience connects with you – your personality, your point of view. Analytics should inform your strategy, not dictate it.
This is where experimentation is key. Use your data to guide your experiments. If your analytics reveal low engagement on long tweets, try breaking them up into shorter threads. If link clicks are low, try different calls to action. It’s a constant process of testing, tweaking, and refining based on what your audience is telling you with their behavior. Think of your analytics dashboard as a compass, not a map. It points you in the right direction, but you still get to choose your own path.
Content Planning With Data As Your Guide
Looking back at your historical analytics can be incredibly valuable. Notice a seasonal increase in engagement? Plan themed content around that. See a consistent dip in engagement on a particular day of the week? Try a different content format or posting time on that day. This is about using past performance to inform your future content calendar.
This type of planning allows you to anticipate your audience’s needs and create content that feels timely and relevant. By looking at past trends, you can even start to predict future performance, which gives you a serious advantage. Remember, it’s a balancing act. Data gives you powerful insights, but your creative intuition is what really brings your content to life.
Advanced Analytics Strategies That Give You An Edge
So you’ve got the basics of checking your Twitter (now X) analytics down. Great! But now, let’s talk about how to really use this data—like the pros do. Basic analytics show you what happened. Advanced strategies tell you why and—most importantly—what to do next.
One of my favorite techniques is cross-platform correlation. Imagine you're promoting a new blog post on both Twitter and LinkedIn. Compare the engagement on each platform. Are you getting tons of retweets but crickets on LinkedIn? That tells you something! Maybe that content is better suited for a Twitter-focused campaign. This saves you time and energy, letting you focus on what works.
Another pro tip? Custom tracking systems. The built-in analytics are good, but they don't tell the whole story. Try using custom shortlinks with UTM parameters. These track clicks from specific tweets to specific pages on your site. It's incredibly helpful to know which calls to action are working and which content pieces drive the best traffic.
Segmenting Your Audience For Deeper Insights
Want to take it even further? Advanced audience segmentation is a game-changer. Twitter's dashboard gives you some basic demographic info, but you can do so much more. Think about your followers’ interests and behaviors. Let’s say you’re a fitness influencer. You could segment your audience into "beginners," "experienced athletes," and "nutrition enthusiasts." Then, tailor your content for each group. Talk about targeted campaigns!
The screenshot above shows the Twitter analytics dashboard. You’ll see all sorts of metrics: impressions, engagement rate, profile visits, and more. Keep a close eye on that engagement rate. Low engagement, even with high impressions, usually means your content needs a refresh.
Don't be discouraged if things don’t always go as planned. Everyone sees dips in engagement sometimes. The important thing is to adapt. Look at your data. What’s working? What’s not? Use that info to refine your strategies.
Analytics isn’t just about collecting data; it’s about using it. Understand your audience. Make better decisions. And stay ahead of the curve. It’s a process of learning and adjusting—and sometimes, trusting your gut. Use your analytics as your guide and you'll be well on your way to reaching your Twitter marketing goals.
Key Takeaways
So, you've made it through the entire journey, from locating your Twitter (X) analytics dashboard to exploring more advanced tactics for gaining a competitive edge. Let's boil everything down to the key takeaways you can put to use right now.
Accessing and Navigating Your Dashboard
Honestly, bookmarking analytics.twitter.com is a game-changer. It cuts through any X/Twitter confusion and lands you right where the data gold is. I manage multiple accounts, and a simple spreadsheet with direct links to each client's analytics keeps me sane. Little tip: business accounts tend to offer a smoother analytics experience than personal ones.
Understanding Key Metrics
Remember, it's about the combination of metrics, not just chasing vanity numbers. Sure, high impressions are nice, but a strong engagement rate (engagements/impressions) shows people are actually interested. I always track follower growth to see if my community is expanding and profile visits to gauge interest in my brand. Replies, retweets, and quote tweets are where the magic happens—that's real engagement, the kind the algorithm loves.
Turning Insights into Content
Analytics aren't just numbers; they tell a story about what your audience actually cares about. I use my analytics to see which content truly resonates. If visuals outperform text, I lean into visuals. If long-form content wins, I give my audience more depth. It's not about blindly following the data, but using it to inspire new creative approaches. Experimentation is key here! I'm always trying different formats, calls to action, and posting times based on what my data tells me.
Monitoring Long-Term Trends
Don't get caught up in the daily fluctuations. Zoom out and look at the big picture. Are you seeing consistent growth, or just sporadic bursts? I always look for seasonal patterns and try to capitalize on them. Recognizing the early warning signs of audience fatigue is crucial, so you can adjust your strategy accordingly. You can even get a sense of competitor activity from shifts in your own analytics.
Advanced Strategies for an Edge
This is where things get interesting. I like to look at cross-platform analysis. How does my Twitter engagement compare to other platforms? Using custom tracking systems like UTM parameters helps me see exactly which content drives traffic to my website. And for targeted campaigns, audience segmentation is powerful. Grouping your followers by interests and tailoring your content accordingly can really boost engagement. Don't be afraid of dips in engagement – they happen. Use those moments to learn, adjust, and refine your strategy. Trust your instincts, but let the data be your guide. It's a constant process of learning and adapting.
Ready to level up your Twitter (X) game? Reply Guy is the secret sauce. It finds trending tweets on your timeline, so you can jump in with timely, high-impact engagement that turns impressions into loyal followers. Check it out and start growing your audience today!