
The Real Power Behind Twitter Engagement Metrics
While follower counts and likes offer a glimpse into your Twitter presence, they don't tell the whole story. True engagement goes beyond these vanity metrics, revealing the depth of your audience connection and its impact on your marketing success. Savvy marketers understand that genuine interaction—replies, quote tweets, and clicks—is the lifeblood of a thriving Twitter strategy. This means shifting focus from superficial numbers to fostering meaningful conversations that resonate with your target audience and drive tangible business outcomes.
A simple like might indicate passive approval, while a reply signifies active interest and a desire to connect. A quote tweet amplifies your message and sparks further discussion, extending your reach beyond your immediate followers. Each type of engagement offers a unique window into your audience's intentions, transforming your content strategy from guesswork to precision targeting. Clicks on links within your tweets demonstrate a clear intent to explore your offerings further, moving potential customers down the sales funnel.
Understanding these nuances allows you to tailor your content to specific audience segments and optimize for desired actions. For example, if you're aiming to drive traffic to your website, focusing on incorporating compelling calls to action with trackable links is key. If building brand awareness is your primary goal, encouraging quote tweets and replies can significantly expand your reach and visibility.
The Importance of Meaningful Interactions
Measuring engagement effectively requires understanding what truly matters. While a high number of likes can be gratifying, they don't necessarily translate into tangible results. True engagement fosters a sense of community and encourages active participation. This could involve responding to comments and questions, participating in relevant conversations, and creating content that encourages interaction. How to master Twitter Analytics & Understanding Engagement Metrics offers further insights into this topic.
Consider this: Twitter's engagement rates have seen a significant decline in recent years, dropping from a median engagement rate of 0.029% in 2024 to 0.015% in 2025. This represents a substantial decrease of approximately 48%. Find more detailed statistics here. This decline underscores the importance of using a robust Twitter engagement rate calculator to accurately assess your performance in this evolving social media environment. Social media engagement metrics are a crucial element of any successful social media strategy.
Think of your Twitter feed as a virtual town square. Simply broadcasting announcements won't generate much buzz. Instead, you need to actively engage with the community, sparking discussions and building relationships. This approach not only boosts your engagement metrics but also fosters a loyal following that values your contributions and amplifies your message organically. By focusing on quality interactions over quantity, you build a strong foundation for sustainable growth and lasting impact on Twitter.
Demystifying Engagement Calculations That Actually Matter
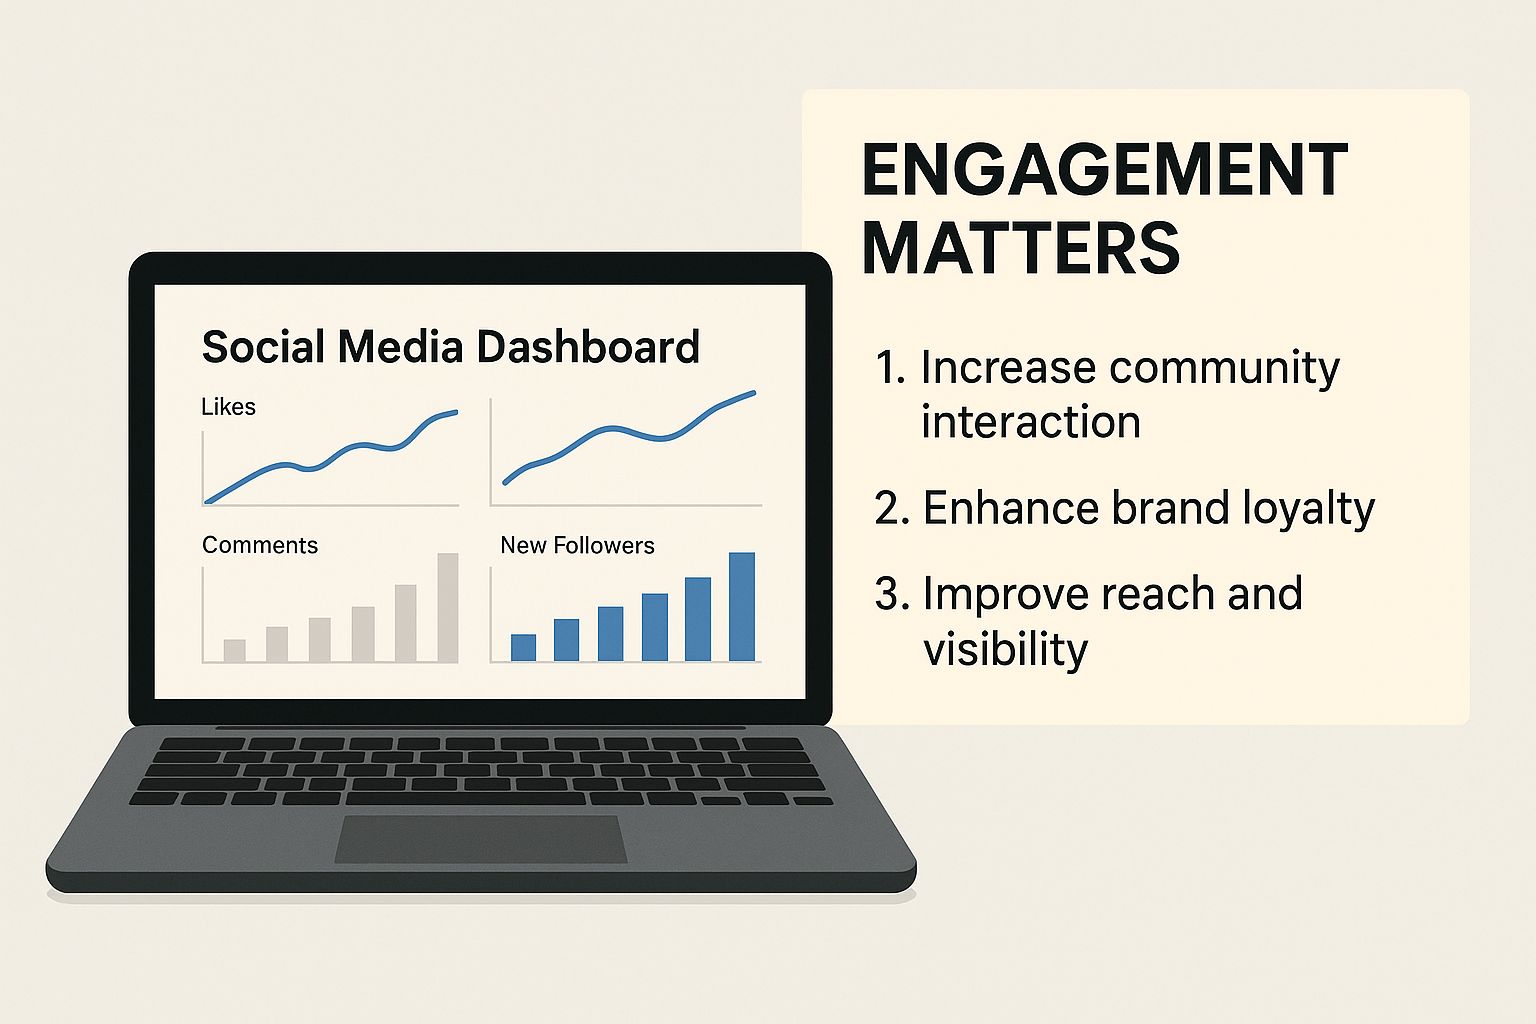
The infographic above illustrates the significance of engagement on Twitter. Visualized data within a social media dashboard highlights how crucial analyzing engagement metrics is for understanding content performance. This underscores the importance of accurate measurement using a reliable Twitter engagement rate calculator. Understanding these metrics is essential for a successful Twitter strategy. For a broader perspective on engagement, explore more about customer engagement metrics.
Let's delve into the core formulas used to calculate Twitter engagement rates.
Exploring Different Engagement Rate Formulas
One common approach is the Engagement Rate by Reach (ERR), calculated as (Total Engagements / Reach) * 100. This formula focuses on the percentage of users who interacted with your content after seeing it. However, reach can be volatile, making it a less stable metric for comparison over time.
Another important metric is the Engagement Rate by Post (ER post), calculated as (Total Engagements / Total Followers) * 100. Using your follower count provides a more stable benchmark, especially when evaluating individual tweet performance. This consistency allows for more reliable comparisons between posts.
The Engagement Rate by Impressions (ER impressions), calculated as (Total Engagements / Total Impressions) * 100, is especially useful for paid campaigns. It reveals how often displayed content results in interaction, offering valuable insights into ad effectiveness.
For video content, the Engagement Rate by Views (ER Views) is key. This is calculated as (Total Engagements on Video / Total Video Views) * 100. It isolates engagement specifically derived from video consumption, helping you understand how your video content resonates with viewers.
Finally, Cost Per Engagement (CPE), calculated as Total Amount Spent / Total Engagements, is invaluable for assessing paid campaign efficiency. It indicates the cost associated with each interaction, allowing you to optimize your budget allocation.
To help you understand the nuances of each calculation method, let's look at the following table:
Twitter Engagement Rate Calculation Methods: This table compares different formulas for calculating Twitter engagement rates, highlighting the pros and cons of each approach.
| Calculation Method | Formula | Best Used For | Limitations |
|---|---|---|---|
| Engagement Rate by Reach (ERR) | (Total Engagements / Reach) * 100 |
Measuring the percentage of users who interacted with content after seeing it | Reach can fluctuate, making comparisons less reliable |
| Engagement Rate by Post (ER post) | (Total Engagements / Total Followers) * 100 |
Analyzing individual tweet performance and providing a stable comparison point | Doesn't account for reach beyond followers |
| Engagement Rate by Impressions (ER impressions) | (Total Engagements / Total Impressions) * 100 |
Evaluating the effectiveness of paid campaigns | Less relevant for organic content |
| Engagement Rate by Views (ER Views) | (Total Engagements on Video / Total Video Views) * 100 |
Assessing engagement specifically with video content | Only applicable to video posts |
| Cost Per Engagement (CPE) | Total Amount Spent / Total Engagements |
Determining the cost-effectiveness of paid campaigns | Not applicable to organic content |
As you can see, each method offers a different lens through which to analyze your Twitter performance.
Choosing the Right Calculation Method
Selecting the appropriate Twitter engagement rate calculator depends on your goals. For tracking organic post performance, ER post offers a consistent benchmark. If you’re focused on maximizing reach with paid campaigns, ER impressions or CPE might be more insightful. For daily interaction analysis, the Daily Engagement Rate (Daily ER) – (Total Daily Engagements / Total Followers) * 100 – provides a valuable overview of account activity.
No single metric paints a complete picture. By strategically combining different calculations, you gain a holistic understanding of your Twitter performance. This comprehensive view allows you to demonstrate the value of your Twitter strategy to stakeholders, justifying social media investments and informing future decisions. Remember, the most effective approach is choosing calculations aligned with your specific business goals and audience dynamics.
Finding Your Perfect Engagement Calculator Match

Beyond Twitter's built-in analytics, a dedicated Twitter engagement rate calculator can significantly improve your social media strategy. These tools provide deeper insights into how your audience interacts with your content, allowing you to identify hidden performance patterns and gain a competitive advantage. Choosing the right calculator, however, depends on your specific needs and goals.
Key Features to Consider
Different organizations prioritize different features based on their size, reporting needs, and objectives. Smaller businesses or individual creators might find value in a simple, free calculator that focuses on basic metrics. Think likes, retweets, and replies. This allows for a quick assessment of content effectiveness without a large investment.
Larger organizations with more complex reporting requirements often need tools with advanced features.
- Automated Reporting: Save time with scheduled reports delivered right to your inbox.
- Competitor Analysis: Benchmark your performance to identify areas for improvement.
- Historical Data Tracking: Analyze trends in engagement to understand audience behavior over time.
- Integration with Other Platforms: Streamline your workflow with seamless data flow between your marketing tools.
Navigating the Calculator Landscape
Numerous Twitter engagement rate calculators exist, each with its own strengths and weaknesses. These include free online calculators, dedicated social media analytics platforms like Hootsuite, and even spreadsheet templates.
Experienced marketers often look for calculators that provide actionable insights. Key features to consider include:
- Customizable Metrics: Track specific engagement types relevant to your goals, such as link clicks or quote tweets.
- Audience Segmentation: Analyze engagement within specific follower groups to uncover deeper audience preferences.
- Real-Time Data Updates: Monitor engagement as it happens to quickly adjust your content strategy.
To help you find the right tool, we've compiled a comparison of several popular options.
To help you choose the right tool, we’ve put together a comparison table showcasing the features of several leading Twitter engagement rate calculators.
Comparison of Twitter Engagement Rate Calculators:
| Tool Name | Key Features | Price Range | Best For | Rating |
|---|---|---|---|---|
| Reply Guy | Pinpoints trending tweets, customizable filters, AI-powered strategy | One-time purchase | Individual creators, social media marketers, small businesses | 4.5/5 |
| Hootsuite | Automated reporting, competitor analysis, multi-platform integration | Varies by plan | Larger organizations, agencies | 4/5 |
| Keyhole | Real-time data, influencer marketing analysis, competitor benchmarking | Varies by plan | Agencies, brands focused on competitive analysis | 4/5 |
| Free Online Calculators | Basic engagement metrics, simple interface | Free | Individual creators, small businesses with limited budgets | 3/5 |
| Spreadsheet Templates | Customizable formulas, manual data entry | Free | Users comfortable with spreadsheets, granular data analysis | 3.5/5 |
This table summarizes the key features, pricing, and ideal user for each tool, making it easier to compare and choose the best fit for your needs. Consider your budget and required features when making your decision.
Avoiding Unnecessary Complexity
While advanced features can be beneficial, it's crucial to choose tools that simplify your analysis, not complicate it. For many, focusing on core metrics like ER post (engagement rate by post) offers sufficient data. This metric, calculated as (Total Engagements on a Post / Total Followers) * 100, provides a solid benchmark for tracking organic content performance.
Focusing on core metrics allows you to transform data into strategic decisions that drive real results. Understanding how these metrics connect with broader Twitter growth strategies will further amplify your impact. By selecting a Twitter engagement rate calculator that aligns with your needs and provides actionable insights, you can unlock the true potential of your Twitter presence. A higher engagement rate often translates to increased visibility, stronger brand awareness, and a more impactful social media presence. Explore the various ways to increase engagement as you refine your Twitter strategy.
Setting Realistic Benchmarks For Your Industry
Setting meaningful benchmarks for your Twitter performance starts with understanding your industry. Instead of focusing on arbitrary numbers, concentrate on creating realistic goals based on your niche, audience size, and content strategy. This requires a data-driven approach, analyzing industry trends, and recognizing that some sectors naturally achieve higher engagement than others.
Industry Engagement Rate Variations
Average engagement rates on Twitter differ significantly across industries. For example, the entertainment and media industry enjoys a high average engagement rate of about 1.7%. Conversely, sectors like consumer goods retail, marketing agencies, and real estate typically see lower engagement rates, around 0.9%. This difference highlights the importance of understanding your target audience and tailoring your content accordingly. Despite these variations, Twitter remains a valuable platform for many businesses, particularly in the B2B space, where 82% of marketers use the platform. Find more detailed statistics here.
Strategies for Setting Progressive Performance Targets
Leading brands often use progressive performance targets instead of fixed metrics. This involves continually evaluating their engagement rate, analyzing what works, and adjusting goals as their audience grows and the platform changes. A brand might initially aim for a 1% engagement rate and then gradually increase this target as they improve their content strategy and build a stronger online community. This iterative approach keeps goals challenging yet achievable.
Adapting to Algorithm Changes
Twitter’s algorithm, like all social media algorithms, constantly evolves. This means that what worked in the past may not be effective today. When setting benchmarks, it’s crucial to consider these algorithm changes and adapt your strategies accordingly. You might be interested in learning more about how to grow your Twitter presence: How to master your daily Twitter growth. Using a Twitter engagement rate calculator, such as the one offered by Reply Guy, helps track these changes and adjust your content strategy. This proactive approach allows you to stay ahead of the curve and maintain strong engagement.
Developing Personalized Benchmarks
Creating personalized benchmarks keeps your team motivated and ensures your goals remain realistic. Key elements of this process include:
- Analyzing Your Historical Data: Examine your past performance to pinpoint areas for improvement.
- Researching Your Competitors: Investigate the engagement rates your competitors are achieving.
- Considering Your Audience Size: Adjust your expectations based on the size and engagement level of your current followers.
By combining these insights, you can create benchmarks specific to your brand and aligned with your overall marketing objectives. This focused approach enables you to measure progress effectively and celebrate significant milestones.
Engagement-Boosting Tactics That Actually Work

Understanding your Twitter engagement rate is just the first step. Let's explore actionable tactics that successful social media managers use to boost their numbers. These strategies combine smart content timing, innovative formats, and an understanding of audience psychology to create truly resonant tweets. This isn't generic advice; it's about learning from what works.
Timing Is Everything: Riding the Wave of Real-Time Trends
Effective brands don't just post randomly; they post strategically. They use real-time trends and current events to join relevant conversations. Imagine a food brand tweeting a humorous take on a trending hashtag related to a popular cooking show. This instantly connects them with a wider audience already engaged with that topic, extending their reach beyond existing followers.
Knowing your audience's online behavior is also crucial. Are they most active during their morning commute, lunch break, or evenings? Tailoring your posting schedule to these peak activity times can significantly increase visibility and engagement. For more insights, check out this helpful resource: How to Master Twitter Engagement & Boost Your Reach.
Format Innovation: Breaking the Text-Only Mold
While text-based tweets are important, diversifying content format is crucial for grabbing attention. Incorporating visuals like images, GIFs, and short videos can significantly increase engagement. A visually appealing image or a funny GIF is much more likely to stop someone mid-scroll than a block of text.
Also, consider using Twitter's platform-specific features. Polls, for example, are a great way to spark conversation and gather audience insights. Running a poll asking followers their opinion on a trending industry topic encourages interaction, provides valuable data, and fuels further engagement.
Content Sequencing: Building Narrative and Sustaining Interest
Effective Twitter engagement isn't about one-off viral hits; it's about building a consistent narrative. Think of your tweets as pieces of a larger puzzle, each contributing to a broader story. This could be a product launch, a brand campaign, or simply sharing your brand's perspective on industry trends. This approach keeps your audience engaged and anticipating your next post.
Content sequencing can also create anticipation. Teasing upcoming announcements, offering behind-the-scenes glimpses, or hosting Q&A sessions can maintain engagement, especially during periods of low activity. This keeps your audience involved and invested in your content.
Leveraging Conversation Triggers: Sparking Meaningful Interactions
Don't just broadcast; start conversations. Ask open-ended questions, respond to comments and mentions, and participate in relevant Twitter chats. This shows your audience that you value their input and builds community.
Consider incorporating conversation triggers into your tweets. This might involve sharing a (reasonable) controversial opinion, posing a thought-provoking question, or asking for feedback on a specific topic. By encouraging interaction, you turn passive viewers into engaged participants. A Twitter engagement rate calculator can help track the success of these tactics and refine your approach for measurable results.
Transforming Data Into Strategic Decisions
Collecting engagement metrics such as likes, retweets, and replies is only the first step. The true power lies in transforming this raw data into strategic, informed decisions. This involves developing monitoring systems that uncover actionable patterns, not just an avalanche of numbers. How can you link fluctuating engagement numbers to specific content choices, audience shifts, and the constantly evolving dynamics of the Twitter platform?
Connecting the Dots Between Data and Decisions
A critical aspect of data-driven decision-making is understanding the why behind engagement fluctuations. For instance, a sudden surge in retweets could be linked to a particularly resonant piece of content, while a drop in replies might suggest a change in audience sentiment. By analyzing these patterns, you can pinpoint what connects with your audience and refine your content strategy accordingly.
Also, consider external influences on your engagement. Twitter's user base and engagement have been significantly affected by broader trends in social media and platform modifications. Since Elon Musk's acquisition in 2022, Twitter has experienced a decline in monthly active users, losing approximately 14.5 million users by the end of 2023 and a further 18.2 million by the end of 2024. Explore this topic further. This highlights the importance of considering external factors when evaluating your own engagement metrics.
Building Simplified Dashboards for Actionable Insights
Effective social media teams are optimizing their data analysis with streamlined dashboards that emphasize key trends while filtering out unnecessary information. These dashboards often concentrate on crucial metrics such as engagement rate by post (ER post), reach, and impressions. By visualizing this data clearly and concisely, teams can quickly identify areas for improvement and modify their strategies in real-time.
Imagine a dashboard as the control panel of an airplane. Pilots don't need to see every single data point the plane generates; they need essential information displayed clearly and concisely to make informed decisions. Likewise, your social media dashboard should present the critical metrics you need to navigate the Twitter environment effectively.
Integrating Engagement Insights into Broader Marketing Strategies
Twitter engagement data shouldn't exist in isolation. Smart marketers incorporate these insights into their wider marketing strategies, influencing decisions beyond social media performance. For example, strong engagement on tweets showcasing a specific product could inform product development choices or marketing campaigns. This comprehensive approach ensures that your Twitter strategy aligns with your overall business goals.
This integration might involve sharing Twitter engagement data with other marketing teams, incorporating social media feedback into product development, or leveraging Twitter insights to shape advertising campaigns. By connecting social media data to the broader context, you demonstrate the value of your Twitter presence and contribute to overall business success.
Reply Guy: Your Partner in Data-Driven Twitter Growth
Navigating the complexities of Twitter analytics can be a challenge. Reply Guy, a robust Chrome extension, assists X (formerly Twitter) creators and marketers in transforming data into strategic actions. By identifying trending tweets and providing AI-powered strategy recommendations, Reply Guy enables you to engage more effectively. Visit Reply Guy today and unlock the full potential of your Twitter presence.