
Unlocking X Success: Understanding Your Metrics
Want faster growth on X (formerly Twitter)? This listicle reveals eight essential Twitter engagement metrics you need to monitor in 2025. Learn how tracking metrics like engagement rate, impressions, click-through rate (CTR), retweets, replies, mentions, follower growth, and share of voice can dramatically improve your content strategy. Understanding these key performance indicators empowers you to optimize your posts, boost engagement, and expand your reach on X. Analyze your Twitter engagement metrics to achieve your social media objectives.
1. Engagement Rate
Engagement rate is arguably the most crucial Twitter engagement metric. It provides a snapshot of how effectively your content resonates with your audience, revealing the percentage of users who actively interact with your tweets. This metric goes beyond mere follower count, focusing on the quality of your audience and their genuine interest in your content. By measuring the proportion of users who like, retweet, reply, click links, or visit your profile after seeing your tweet, engagement rate provides valuable insights into content performance and audience engagement.
Calculating your engagement rate involves dividing the total number of engagements on a tweet by the total number of impressions (the number of times your tweet was displayed) and multiplying by 100. This is expressed as: (Total Engagements ÷ Total Impressions) × 100. While some also calculate engagement rate based on follower count, using impressions provides a more accurate picture, normalizing performance regardless of audience size. This allows for fair comparisons between accounts with vastly different follower numbers. For example, a tweet with 100 engagements and 10,000 impressions has a 1% engagement rate, while a tweet with 50 engagements but only 1,000 impressions boasts a 5% engagement rate, showcasing its superior performance despite fewer overall interactions.
Engagement rate can be measured per tweet or averaged across specific time periods, offering a granular or holistic view of your performance. Tracking engagement rate consistently allows you to identify your most effective content types, understand audience preferences, and refine your content strategy. It's also a key metric for measuring the return on investment (ROI) of your Twitter marketing efforts, demonstrating the impact of your activities on audience engagement.
Several high-profile accounts leverage high engagement rates for success. Wendy's, for example, consistently achieves 3-5% engagement rates through witty, conversational content that resonates with their target demographic. NASA regularly sees 2-4% engagement with their captivating space photography and educational posts. Smaller businesses and niche communities often see even higher engagement rates (5-10%) due to closer community connections and more personalized interactions. Learn more about Engagement Rate.
While a powerful metric, engagement rate has its limitations. It can be skewed by viral content or outlier posts, making it important to consider trends over time rather than focusing on individual tweets. It also doesn't account for the quality of engagement – a simple like holds less weight than a meaningful reply or retweet. Additionally, posting time and frequency significantly impact engagement rate, and different calculation methods can lead to inconsistencies when benchmarking against competitors.
Pros of Tracking Engagement Rate:
- Provides a clear picture of content quality and audience interest
- Allows comparison between accounts of different sizes
- Helps identify most effective content types
- Key metric for measuring ROI of Twitter marketing efforts
Cons of Tracking Engagement Rate:
- Can be skewed by viral content or outlier posts
- Doesn't account for quality of engagement
- May vary significantly based on posting time and frequency
- Different calculation methods can lead to inconsistent benchmarking
The following bar chart visualizes engagement rate benchmarks, categorizing performance into three tiers: Average (0.5-1%), Good (1-3%), and Excellent (3%+).
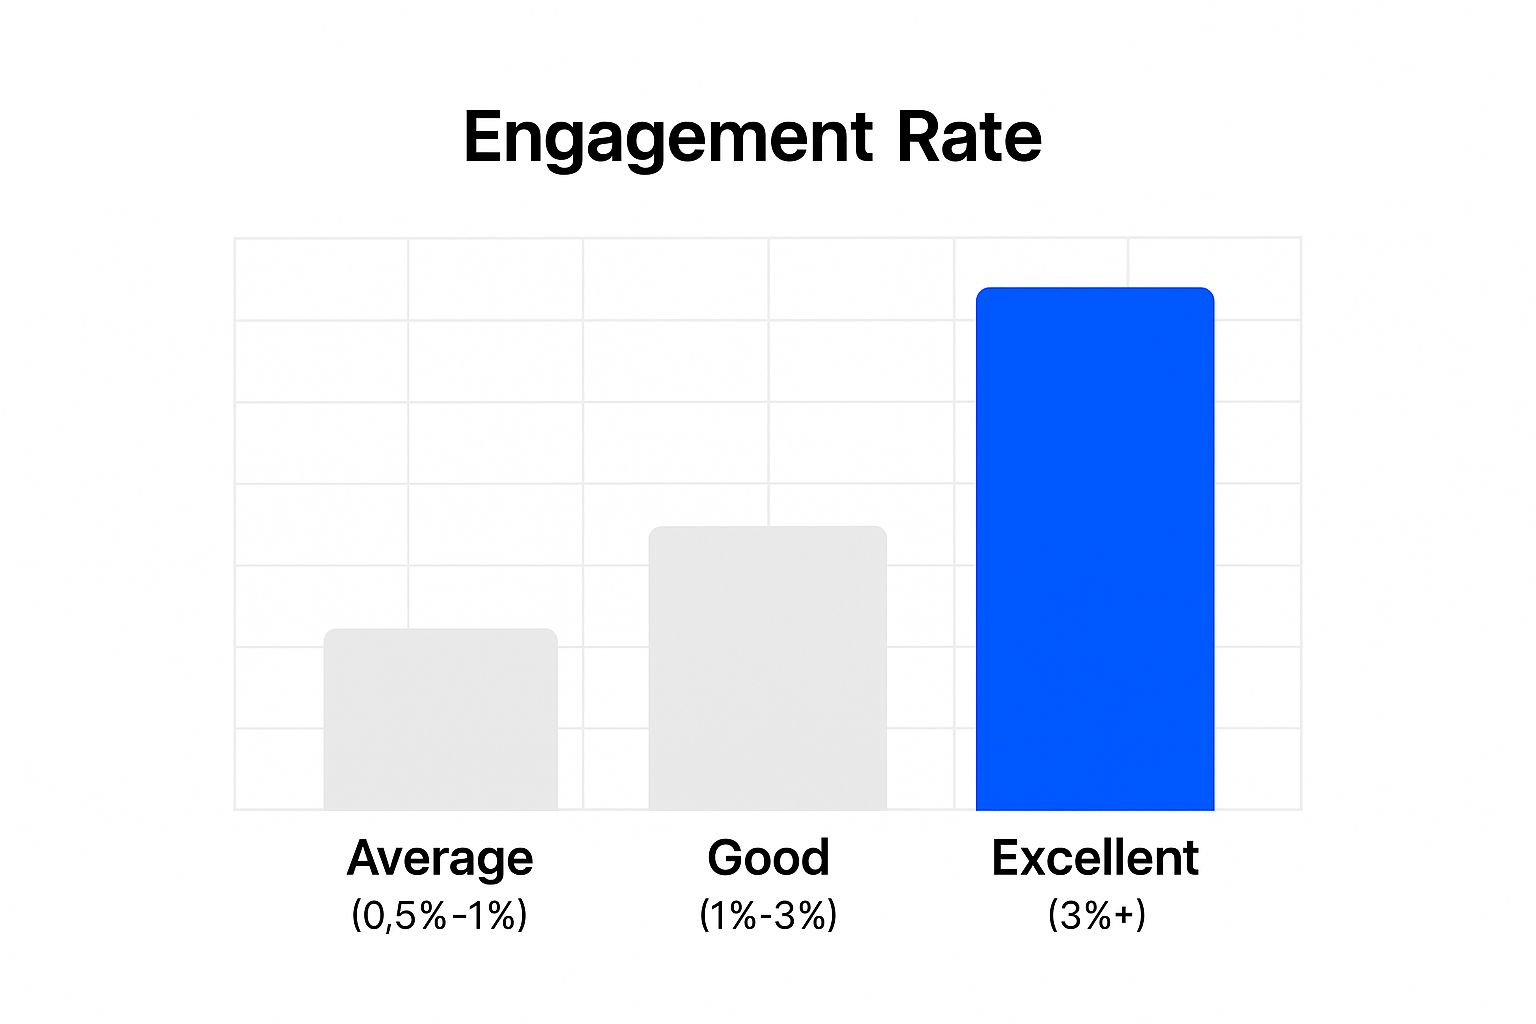
As the chart clearly illustrates, achieving an engagement rate above 3% signifies excellent performance, while anything between 1-3% is considered good. This visualization helps contextualize your engagement rate and provides targets for improvement.
Tips for Increasing Engagement Rate:
- Aim for 1-3%: This is a good benchmark for most accounts.
- Post during peak hours: Identify when your audience is most active on Twitter.
- Use compelling visuals: Images and videos significantly boost engagement.
- Ask questions: Encourage interaction by posing questions to your audience.
- Engage back: Respond to comments and mentions to foster a sense of community.
By understanding and actively tracking your Twitter engagement rate, you gain valuable insights into your audience, refine your content strategy, and ultimately maximize your impact on the platform.
2. Impressions
Impressions are a foundational Twitter engagement metric that provides a crucial understanding of your content's visibility and potential reach within the platform. In the bustling marketplace of Twitter, where countless tweets compete for attention, impressions offer a glimpse into how often your content appears in front of users. This metric represents the total number of times a tweet has been displayed, regardless of whether users interacted with it. Understanding and leveraging impressions is essential for anyone seeking to grow their audience and maximize their impact on Twitter, making it a critical component of any successful Twitter strategy.
At its core, an impression is counted every single time your tweet appears on a user's timeline, search results, or profile. This includes instances where users scroll past your tweet without clicking, liking, or retweeting. It's important to distinguish impressions from other engagement metrics like likes or retweets, which represent active interactions. Impressions, on the other hand, measure potential exposure. Think of it like this: every impression is an opportunity for your tweet to be seen, even if that opportunity doesn't always translate into direct engagement.
Why are Impressions Important?
Impressions matter because they offer valuable insights into several key aspects of your Twitter performance:
- Content Reach and Visibility: A high impression count suggests your content is being distributed widely and has the potential to reach a large audience. This is particularly important for brand awareness and visibility campaigns.
- Algorithm Favorability: Twitter's algorithm prioritizes content it deems relevant and engaging. Consistently high impressions can indicate that the algorithm is favoring your content and distributing it more widely.
- Content Amplification: Retweets significantly contribute to impression growth. A tweet that gets retweeted by users with large followings can see its impressions skyrocket, exponentially increasing its reach.
- Benchmarking Performance: Tracking impressions over time allows you to monitor the effectiveness of your content strategy and identify trends. You can see what type of content resonates with your audience and generates the most impressions.
- Calculating Engagement Rate: Impressions serve as the denominator when calculating your engagement rate. Engagement rate is a valuable metric that measures the percentage of people who interacted with your tweet out of the total number of impressions.
Features of Twitter Impressions:
- Comprehensive Counting: Impressions are counted every time a tweet appears, whether in a user's timeline, search results, or profile.
- Inclusive of Paid and Organic: Both organic (unpaid) and paid (promoted) tweet impressions are tracked, allowing you to assess the effectiveness of your paid campaigns.
- Potential to Exceed Follower Count: Through retweets and algorithmic distribution, your tweet impressions can significantly surpass your follower count, reaching a much wider audience.
- Detailed Tracking in Twitter Analytics: Twitter Analytics provides in-depth data on impressions, allowing you to analyze trends and refine your strategy.
Pros and Cons of Using Impressions as a Metric:
Pros:
- Measures potential audience exposure.
- Helps understand content distribution effectiveness.
- Useful for calculating other metrics like engagement rate.
- Indicates algorithm favorability and content amplification.
Cons:
- Doesn't guarantee actual viewing or attention.
- Can be inflated by bot accounts or inactive users.
- High impressions with low engagement may indicate poor content quality.
- Doesn't distinguish between brief glimpses and focused attention.
Examples of Successful Implementation:
- Major Brands: Companies like Coca-Cola regularly achieve millions of impressions per campaign, leveraging trending hashtags and engaging visuals.
- Breaking News Accounts: News outlets often experience massive impression spikes during major events, demonstrating the power of timely and relevant content.
- Influencers: Successful influencers typically aim for an impression-to-follower ratio of 2:1 or higher, indicating strong reach and visibility within their niche.
Tips for Increasing Your Twitter Impressions:
- Strategic Hashtag Usage: Research and use relevant trending hashtags to expand your reach and increase the discoverability of your tweets.
- Optimal Posting Times: Identify when your target audience is most active on Twitter and schedule your tweets accordingly to maximize organic reach.
- Compelling Content Creation: Focus on creating high-quality, shareable content that encourages retweets and amplifies your message. Visual content, such as images and videos, tends to perform well.
- Monitor and Analyze: Regularly track your impression trends in Twitter Analytics to understand what's working and adjust your posting strategy accordingly. Identify patterns in your top-performing tweets and replicate their success.
By understanding and effectively utilizing the Twitter impressions metric, you can gain valuable insights into your content’s reach and visibility, optimize your tweeting strategy, and ultimately grow your presence on the platform. This makes impressions a crucial metric for anyone seeking to succeed in the dynamic world of Twitter.
3. Click-Through Rate (CTR)
Click-through rate (CTR) is a crucial Twitter engagement metric that measures the percentage of people who click on a link, image, or call-to-action in your tweet after seeing it. In the context of Twitter, where driving traffic and encouraging specific actions are key objectives for many users, CTR provides valuable insights into how effectively your tweets are prompting users to engage beyond the platform itself. Whether you're directing users to an external website, encouraging app downloads, or promoting a specific hashtag, CTR is a direct indicator of your content's ability to motivate action. This makes CTR an essential metric for evaluating the success of your Twitter strategy and optimizing your tweets for better performance. This metric is critical for measuring how effectively your tweets drive traffic to external websites or specific actions, contributing significantly to achieving your overall Twitter goals.

CTR is calculated as (Total Clicks ÷ Total Impressions) × 100. This seemingly simple formula provides powerful insights into how resonant your content is with your audience. It tracks clicks on various interactive elements within your tweets, including links, images, hashtags, and even profile links, offering a comprehensive view of user engagement. This data can be analyzed for individual tweets to understand which specific posts are performing well, or it can be averaged across a campaign to evaluate overall effectiveness. For marketers, CTR is essential for measuring conversion funnel effectiveness as it directly reflects how successfully tweets are moving users towards desired actions.
Understanding the strengths and weaknesses of CTR is vital for its effective interpretation. One of the key benefits is its ability to directly measure the effectiveness of your content in driving action. This is particularly critical for ROI calculation in marketing campaigns, as it provides quantifiable data on the return generated by your Twitter efforts. CTR also helps identify the most effective call-to-action strategies by highlighting which approaches resonate most with your audience. Furthermore, it serves as a strong indicator of audience interest in your offerings or content. However, CTR can be influenced by factors like link preview quality and description, which can impact user perception and click-through behavior. It also doesn't account for actions taken after clicking the link, providing only a partial view of the user journey. Mobile user behavior patterns can also influence CTR, often resulting in lower click-through rates compared to desktop users. Finally, accidental clicks or bot activity can skew the data, necessitating careful monitoring and interpretation.
Different industries and content types experience varying CTR benchmarks. For instance, e-commerce brands like ASOS often achieve a 2-4% CTR with product showcase tweets, leveraging visually appealing imagery and compelling offers. News organizations like BBC News, on the other hand, can see a 3-6% CTR on breaking news stories due to the time-sensitive nature and high public interest in such content. SaaS companies often achieve a 1-2% CTR on educational content with clear CTAs, focusing on providing value and guiding users towards specific actions.
To maximize your Twitter CTR, consider the following actionable tips: Include compelling preview text and clear value propositions in your tweets to entice users to click. Use action-oriented language in your call-to-action to create a sense of urgency and encourage immediate engagement. Experiment with different link placement positions within your tweets to determine the most effective approach. And finally, optimize link preview images and descriptions for maximum appeal, ensuring they accurately reflect the content being linked and capture the user's attention. Learn more about Click-Through Rate (CTR) and delve deeper into strategies for optimizing this critical Twitter engagement metric. By understanding and effectively utilizing CTR, you can significantly enhance your Twitter performance and achieve your desired outcomes.
4. Retweet Rate
Retweet rate is a key Twitter engagement metric that measures the proportion of users who saw your tweet and subsequently shared it with their own followers. It provides valuable insights into how compelling and shareable your audience finds your content. A high retweet rate signals that your tweets resonate with your audience, prompting them to amplify your message within their own networks. This metric is essential for understanding the virality of your content and the level of advocacy within your audience. It's a powerful indicator of how well your content is performing in terms of encouraging organic spread and reach. By analyzing and optimizing your retweet rate, you can significantly improve your content's visibility and overall impact on Twitter, now known as X. This metric deserves a prominent place in any Twitter analytics strategy as it directly reflects the organic reach potential of your tweets.

The retweet rate is calculated by dividing the total number of retweets a tweet receives by the total number of impressions (the number of times the tweet was displayed) and then multiplying the result by 100. This provides a percentage that represents the proportion of viewers who retweeted the content. It’s important to note that this includes both regular retweets and quote tweets, giving a comprehensive view of how users are choosing to share your content. This amplification through follower networks is a powerful mechanism for extending the reach of your messages far beyond your immediate follower base. It represents a form of organic, user-driven endorsement of your content.
For X creators, social media marketers, businesses, and influencers aiming for organic growth, understanding and leveraging the retweet rate is crucial. It offers a direct measure of how well your content resonates and encourages sharing, a cornerstone of viral growth. For instance, viral memes frequently achieve retweet rates of 10-20% or even higher, demonstrating the power of shareable content. The ALS Ice Bucket Challenge serves as another prime example, achieving massive retweet amplification and raising significant awareness and funds. Even in the realm of news dissemination, breaking news from verified journalists regularly achieves retweet rates of 5-15%, highlighting the metric's importance across diverse content categories.
Here's a breakdown of the advantages and disadvantages of focusing on retweet rate:
Pros:
- Extended Reach: Retweets propel your content beyond your immediate followers, exposing it to a much wider audience.
- Content Quality Indicator: High retweet rates suggest your content is valuable, engaging, and resonates with your target audience.
- Cost-Effective Brand Awareness: Organic retweets are a free and effective way to boost brand visibility and reach new potential customers.
- Social Proof & Credibility: Increased retweets build social proof and establish your credibility within your niche.
Cons:
- Potential for Manipulation: Retweet exchanges or the use of bots can artificially inflate the retweet rate, providing a misleading picture of genuine engagement.
- Correlation with Business Results: A high retweet rate doesn't always translate directly into tangible business outcomes like sales or conversions.
- Controversy vs. Positivity: High retweet rates can sometimes indicate controversial or polarizing content rather than universally positive reception.
- Negative Quote Tweets: Quote tweets, while contributing to the overall retweet rate, can also include negative commentary that may harm brand perception.
To maximize your retweet rate, consider the following actionable tips:
- Create Value-Driven Content: Focus on creating content that provides genuine value to your target audience, making it worth sharing with their followers.
- Strategic Hashtag Usage: Utilize trending topics and relevant hashtags to increase the discoverability of your tweets and reach a broader audience.
- Visual Appeal: Incorporate compelling visuals like images, infographics, or videos to make your tweets more engaging and shareable.
- Call to Action: Don't hesitate to directly ask your followers to retweet your content, particularly for important messages or causes.
By understanding the nuances of retweet rate, its calculation, its significance, and potential pitfalls, you can leverage this powerful metric to amplify your message, expand your reach, and build a stronger presence on X. It’s a crucial component of a comprehensive Twitter engagement strategy, providing invaluable insights into content performance and audience response.
5. Reply Rate
Reply rate is a crucial Twitter engagement metric that measures the percentage of your tweets that receive replies. It provides a valuable snapshot of how effectively your content sparks conversation and fosters community engagement, essentially reflecting the two-way conversational nature of your Twitter presence. For anyone looking to grow their audience, cultivate a loyal following, or build a strong brand on Twitter, understanding and actively working to improve your reply rate is essential. This metric deserves its place on any list of important Twitter engagement metrics because it goes beyond superficial likes and retweets, delving into the actual conversational depth of your audience interaction.
Reply rate is calculated with a simple formula: (Total Replies ÷ Total Tweets) × 100. This straightforward calculation reveals how many of your tweets are actually prompting responses from your audience. A high reply rate indicates that your content is resonating with your followers on a deeper level, encouraging them to engage in conversation rather than just passively consuming your content. It signals genuine interest and active participation, which is significantly more valuable than metrics that can be easily inflated by bots or superficial engagement.
This metric is particularly relevant for several key groups on Twitter. Individual creators seeking faster audience growth can leverage reply rate to understand what content truly resonates with their target audience and to build genuine connections with followers. Social media marketers and consultants can use reply rate to assess the effectiveness of their campaigns and to identify areas for improvement in client strategies. Small businesses aiming to expand their brand presence on Twitter can utilize reply rate to build customer relationships, gather feedback, and foster a sense of community around their brand. Influencers and content creators looking for organic growth can use reply rate to gauge the authenticity of their engagement and identify content that drives meaningful interactions. Even social media beginners and hobbyists wanting to build a following can benefit from tracking their reply rate to learn what resonates with their audience.
Several features make reply rate a powerful metric: it measures two-way conversation initiation, indicates audience engagement depth, and serves as a key metric for community building and customer service. For brands, a robust reply rate can be instrumental in providing effective customer service and building strong relationships with their audience. For individuals, it’s a powerful way to foster a sense of community and belonging amongst followers.
The pros of a strong reply rate are numerous. It clearly shows genuine audience interest and engagement, going beyond passive consumption of content. A healthy reply rate facilitates relationship building with followers, turning them into active participants in your online community. It also provides invaluable feedback and insights from your audience, allowing you to understand their perspectives, needs, and interests. Furthermore, active conversations within your tweet threads increase your overall tweet visibility, expanding your reach organically.
However, like any metric, reply rate also has its cons. Sometimes, a very high reply rate might indicate that your content is controversial, potentially attracting negative attention or sparking heated debates. Managing a high volume of replies requires a significant time investment to respond appropriately and thoughtfully. You should also be prepared for the possibility of negative feedback or criticism, which requires careful handling to avoid escalating conflict. Finally, your reply rate might be skewed by spam or irrelevant responses, making it important to monitor and filter these out for an accurate assessment.
There are numerous examples of successful implementation of strategies to boost reply rates. Customer service accounts like @SpotifySupport often achieve high reply engagement by promptly addressing customer queries and concerns. Influencers who regularly ask open-ended questions to their followers typically see reply rates in the 5-15% range. Brands hosting Twitter chats can achieve even higher reply rates, often in the 20-40% range, during these focused events.
To improve your own reply rate, consider these actionable tips: Ask open-ended questions to encourage responses and foster discussion. Respond promptly to replies to maintain conversation momentum and show your audience that you value their engagement. Use polls and other interactive content to generate discussions and gather opinions. And, while it should be done thoughtfully and with respect for differing viewpoints, sharing (occasionally) controversial opinions can be a powerful way to spark debate and increase interaction. Learn more about Reply Rate to discover more strategies for maximizing your Twitter engagement. By understanding the nuances of reply rate and actively working to improve it, you can cultivate a thriving community on Twitter and achieve your goals, whether they be brand building, audience growth, or simply connecting with like-minded individuals.
6. Mention Rate
Mention rate is a crucial Twitter engagement metric that measures how often your brand, username, or relevant keywords are mentioned by other users. It provides valuable insights into your brand awareness, the sentiment surrounding your brand, and your share of voice within relevant conversations on the platform. Tracking your mention rate helps you understand how visible and impactful your brand is in the bustling Twittersphere. This metric deserves its place on the list of essential Twitter engagement metrics because it offers a direct window into how people are talking about your brand, both positively and negatively, and provides actionable data to improve your social media strategy.
How Mention Rate Works
Mention rate tracks various forms of mentions on Twitter, encompassing several key elements:
- @mentions: These are direct mentions using your Twitter handle (e.g., @YourBrandName). They signify direct engagement and are easily trackable.
- Brand Name Mentions: These include instances where users mention your brand name without using the @ symbol (e.g., "I love YourBrandName's products!"). Tracking these mentions provides a more comprehensive view of brand awareness beyond direct interactions.
- Keyword Variations: This involves monitoring mentions of specific keywords relevant to your brand, industry, or campaigns. For example, a software company might track mentions of "project management software" or "productivity tools."
Mention rate can be measured in several ways:
- Mentions per Time Period: This involves tracking the number of mentions within a specific timeframe (e.g., mentions per hour, day, week, or month). This allows you to monitor trends and identify spikes in conversation.
- Mention Volume Trends: This focuses on analyzing the overall trend of mentions over a longer period. It helps you understand how your brand visibility is evolving and the impact of specific campaigns or events.
It's important to note that mention rate encompasses both direct mentions and indirect brand references. While direct mentions are easy to capture, identifying indirect references often requires sophisticated social listening tools. Furthermore, combining mention rate with sentiment analysis provides deeper insights by revealing whether these mentions are positive, negative, or neutral.
Examples of Successful Mention Rate Implementation
- Major Events: During high-profile events like the Super Bowl, brands that run impactful ads often see their mention rate skyrocket. Thousands of mentions per hour are not uncommon, demonstrating the immediate impact of successful campaigns.
- Customer Service Crises: Conversely, negative events like customer service crises can also dramatically spike mention rates, often by 500-1000%. Monitoring these spikes allows brands to quickly identify and address issues, mitigating reputational damage.
- Product Launches: Successful product launches typically generate significant buzz on social media, leading to a 200-300% increase in mention rates. This provides valuable feedback on product reception and helps identify potential influencers or brand advocates.
Pros and Cons of Tracking Mention Rate
Pros:
- Measures Organic Brand Awareness and Reach: Mention rate provides a direct measure of how widely your brand is being discussed organically on Twitter.
- Provides Real-Time Feedback and Customer Insights: Tracking mentions offers real-time access to customer opinions, feedback, and sentiment.
- Helps Identify Brand Advocates and Influencers: Users who frequently mention your brand positively can be valuable advocates or potential influencers.
- Enables Proactive Customer Service and Reputation Management: Monitoring mentions allows you to identify and respond to customer service issues promptly and manage your brand reputation effectively.
Cons:
- Can Include Negative Mentions and Criticism: Not all mentions will be positive, and tracking mention rate exposes your brand to potential criticism and negative feedback.
- Requires Monitoring Tools for Comprehensive Tracking: Tracking all forms of mentions, especially indirect references, often requires specialized social listening tools.
- May Include Spam or Irrelevant Mentions: Some mentions might be spam or irrelevant to your brand, requiring filtering and analysis to extract meaningful insights.
- High Mention Rates Don't Always Correlate with Positive Sentiment: A high mention rate doesn't necessarily mean positive brand sentiment. It's crucial to analyze the context and sentiment of the mentions.
Actionable Tips for Utilizing Mention Rate
- Use Social Listening Tools: Leverage social listening tools like Hootsuite, Brandwatch, or SproutSocial for comprehensive mention tracking and analysis.
- Respond to Mentions Promptly: Engage with users who mention your brand, especially those with customer service issues or questions.
- Track Competitor Mention Rates: Monitor your competitors' mention rates to understand their share of voice and identify potential opportunities.
- Identify and Engage with Brand Advocates: Cultivate relationships with users who frequently mention your brand positively.
- Analyze Sentiment: Don't just track the volume of mentions; analyze the sentiment to understand the overall perception of your brand.
By understanding and effectively utilizing mention rate, you can gain valuable insights into your brand's presence on Twitter, improve your social media strategy, and foster stronger relationships with your audience.
7. Follower Growth Rate
Follower growth rate is a crucial Twitter engagement metric that measures the speed at which your account gains new followers over a specific period. It provides valuable insights into the effectiveness of your content strategy, the overall health of your account, and the growth of your brand awareness within the Twittersphere. This metric deserves its place on any list of essential Twitter engagement metrics because it directly reflects your ability to attract and retain an audience on the platform. For individual creators, social media marketers, small businesses, and influencers alike, understanding and optimizing follower growth rate is key to expanding reach and achieving Twitter success.
Follower growth rate isn't simply about accumulating a large number of followers; it's about cultivating a thriving community around your brand or personal profile. A steadily increasing follower count signals that your content resonates with your target audience and that your overall Twitter presence is appealing. This, in turn, can lead to increased engagement, wider reach, and ultimately, achievement of your Twitter goals, whether that's driving website traffic, generating leads, or building a loyal following.
How It Works
Follower growth rate is calculated by considering both the influx of new followers and the outflow of unfollowers (churn) within a defined timeframe. This provides a more accurate picture of growth than simply looking at the total follower count. The formula is as follows:
((New Followers - Lost Followers) ÷ Total Followers at the beginning of the period) × 100
This metric can be tracked daily, weekly, monthly, or quarterly, allowing you to analyze short-term trends and long-term growth patterns. Monitoring the rate regularly helps you identify what content or strategies are driving follower growth and what might be causing people to unfollow.
Features and Benefits
- Accounts for Churn: Unlike simply looking at the total follower count, the follower growth rate formula accounts for both gains and losses, providing a more realistic view of your audience growth.
- Flexibility in Measurement: The ability to track growth daily, weekly, monthly, or quarterly allows you to analyze trends over different time horizons and adjust your strategies accordingly.
- Indicates Long-Term Momentum: Consistent monitoring of follower growth rate helps you understand the overall trajectory of your account and identify sustainable growth patterns.
- Justifies Investment: Demonstrating a positive follower growth rate can help justify social media marketing investments and showcase the return on effort.
Pros and Cons
Pros:
- Brand Awareness & Appeal: A healthy follower growth rate signifies growing brand awareness and overall account appeal within your target audience.
- Content Strategy Effectiveness: It provides valuable feedback on the effectiveness of your content strategy and highlights what resonates with your audience.
- Increased Reach and Engagement Potential: A larger, engaged following translates to increased reach and potential for higher engagement on your tweets.
- Marketing ROI Justification: A consistently growing follower base can be used to demonstrate the effectiveness of your social media marketing efforts.
Cons:
- Potential for Artificial Inflation: Tactics like follow-for-follow can artificially inflate follower counts but don't necessarily translate to genuine engagement or a quality audience.
- Doesn't Reflect Follower Quality: The metric doesn't account for the quality or engagement levels of your followers. A large follower count with low engagement can be less valuable than a smaller, highly engaged audience.
- External Factors: External events, trending topics, and even algorithm changes can significantly influence follower growth rates, making it important to consider context.
- Slow Growth Can Be Discouraging: Even with good engagement, a slow follower growth rate can be discouraging, especially for new accounts. It’s important to focus on long-term strategies and consistent content delivery.
Examples of Successful Implementation
- Startups: Successful startups often experience rapid follower growth, sometimes achieving monthly growth rates of 5-15% as they build brand awareness and generate buzz.
- Viral Campaigns: Highly successful viral marketing campaigns can lead to dramatic spikes in follower growth, sometimes reaching 50-200% in short periods.
- Established Brands: Established brands with a solid online presence typically maintain steady follower growth rates of 1-5% monthly.
Actionable Tips for Increasing Follower Growth Rate
- Target Relevant Followers: Focus on attracting followers who are genuinely interested in your content and represent your target audience. Quality over quantity is key.
- Collaborate and Engage: Collaborate with influencers and other brands in your niche to expand your reach and gain exposure to new audiences.
- Consistent Value-Driven Content: Consistently post high-quality, valuable content that resonates with your target audience and encourages follows.
- Strategic Use of Twitter Ads: Utilize Twitter's advertising platform to strategically target specific demographics and interests, reaching potential followers who might not discover you organically.
- Engage with Your Audience: Respond to comments, mentions, and direct messages to foster a sense of community and encourage interaction.
Learn more about Follower Growth Rate
By understanding the nuances of follower growth rate and implementing these strategies, you can build a thriving and engaged community on Twitter, ultimately achieving your marketing goals and solidifying your presence on the platform. Remember to track your progress consistently and adapt your approach based on the data you gather.
8. Share of Voice
Share of Voice (SOV) is a crucial Twitter engagement metric that measures the proportion of conversations related to your industry, specific keywords, or topics that your brand owns compared to your competitors. It's a powerful indicator of your brand's visibility, influence, and relative position within the bustling Twitter landscape. For anyone seeking faster audience growth, from individual creators to small businesses and experienced marketers, understanding and leveraging Share of Voice is essential for achieving a competitive edge.
This metric allows you to gauge how prominently your brand features in relevant Twitter conversations. Are you leading the discussion, or are your competitors dominating the narrative? By calculating your SOV, you can gain valuable insights into your market standing and identify areas for improvement. It provides a quantifiable measure of your brand's impact within your target market on Twitter, offering a clear picture of where you stand amongst the competition.
How does Share of Voice work? The calculation is relatively straightforward:
(Your Brand Mentions ÷ Total Industry Mentions) × 100
This formula provides a percentage representing your SOV. For instance, if your brand is mentioned 200 times in conversations related to a specific keyword, and the total number of mentions for that keyword across all relevant brands is 1000, your SOV would be 20%.
The benefits of tracking Share of Voice are numerous. It offers:
- Clear competitive positioning insights: Understand where you stand against your rivals. Are you a dominant player, a niche contender, or struggling to be heard?
- Identification of market opportunities and gaps: Discover untapped conversation areas where your brand can contribute and potentially gain a competitive advantage.
- Measurement of brand influence: SOV provides a tangible measure of your brand's authority and impact relative to the overall market conversation.
- Realistic target setting: SOV helps you establish achievable growth benchmarks. Instead of aiming for abstract growth, you can set specific targets for increasing your share of the conversation.
However, Share of Voice isn't without its limitations:
- Comprehensive competitor identification: Accurately calculating SOV requires thorough research to identify all relevant competitors. Missing key players can skew your results.
- Impact of viral content: Viral tweets or one-time events can disproportionately influence SOV, providing a temporary and potentially misleading picture of your brand's typical presence.
- Correlation with market share: While insightful, SOV doesn't necessarily correlate directly with actual market share or business performance. A high SOV doesn't guarantee high sales.
- Keyword variations: Tracking SOV across all possible relevant keywords and variations can be complex and challenging.
Successful implementation of SOV analysis can be seen across various industries. For example, streaming giants like Netflix often dominate the conversation around online entertainment, achieving a Share of Voice between 40-60% on related topics. Similarly, during product launches, tech giants like Apple frequently capture 70-80% of the social media chatter. Even smaller businesses, such as local restaurants, can benefit from SOV analysis, aiming for a 10-20% share within their specific geographic market.
To effectively leverage Share of Voice for Twitter engagement, consider these actionable tips:
- Utilize social listening tools: Employ tools like Brandwatch or Sprout Social for comprehensive tracking and analysis of brand mentions and competitor activity.
- Focus on relevant keywords: Prioritize high-intent keywords directly related to your brand and offerings rather than broad, generic terms.
- Monitor competitor campaigns: Observe successful strategies employed by your competitors and adapt them to your own approach.
- Engage with trending topics: Create relevant and engaging content around trending industry topics to increase your brand's visibility and boost your SOV.
- Learn more about Share of Voice. This resource provides valuable insights into engaging with trending tweets, a key strategy for enhancing your Share of Voice.
By understanding and strategically utilizing Share of Voice as a key twitter engagement metric, you can gain a significant advantage in the competitive social media landscape, effectively grow your audience, and solidify your brand's presence on Twitter. This metric empowers you to not only measure your current impact but also identify opportunities to amplify your voice and drive meaningful engagement.
8 Twitter Engagement Metrics Comparison
| Metric | ⭐ Expected Outcomes / Impact 📊 | 🔄 Implementation Complexity | ⚡ Resource Requirements | 💡 Ideal Use Cases / Insights | Key Advantages |
|---|---|---|---|---|---|
| Engagement Rate | Shows content quality and audience interest clearly; key for ROI | Moderate: requires tracking engagements and impressions | Medium: needs analytics tools for engagement data | Measuring content effectiveness; benchmarking; ROI tracking | Normalizes for audience size; identifies effective content |
| Impressions | Measures total potential audience exposure and reach | Low: simply count tweet displays | Low: native Twitter Analytics suffices | Assessing content visibility and distribution reach | Indicates reach amplification; useful for overall exposure |
| Click-Through Rate (CTR) | Direct measure of driving traffic and conversions | Moderate: track clicks relative to impressions | Medium: needs link tracking and analytics tools | Campaign effectiveness; optimizing calls-to-action | Measures audience action; critical for ROI |
| Retweet Rate | Indicates content virality and shareability | Moderate: track retweets vs impressions | Medium: analytics tools needed | Content amplification; brand awareness growth | Extends reach cost-effectively; builds social proof |
| Reply Rate | Reflects conversational engagement and community growth | Medium: track replies per tweet or overall tweet count | Medium-High: requires monitoring and timely responses | Customer service; community engagement; feedback gathering | Fosters relationships; increases visibility |
| Mention Rate | Tracks brand awareness, sentiment, and share of voice | High: requires comprehensive mention and sentiment tracking | High: needs social listening tools | Reputation management; brand tracking; competitor analysis | Real-time feedback; identifies advocates and issues |
| Follower Growth Rate | Indicates audience growth and brand appeal over time | Low-Medium: calculate follower changes over time | Low-Medium: basic analytics tools suffice | Monitoring brand growth; marketing investment justification | Shows momentum; correlates with reach and engagement |
| Share of Voice | Measures brand influence relative to competitors | High: requires competitor and keyword mention aggregation | High: advanced analytics and competitive tracking | Market positioning; competitive analysis; strategic planning | Clear competitive insights; identifies market opportunities |
Elevate Your X Strategy: Mastering Twitter Engagement Metrics
Mastering your Twitter engagement metrics is crucial for success on X in 2025. Throughout this article, we've explored eight essential metrics—from engagement rate and impressions to follower growth rate and share of voice—providing a comprehensive guide to understanding your audience and content performance. By analyzing these key metrics, you can identify what resonates with your followers, refine your content strategy, and ultimately, amplify your impact on the platform. Remember, consistent monitoring and analysis of these Twitter engagement metrics is the key to unlocking sustainable growth and achieving your social media objectives. This knowledge empowers you to make data-driven decisions, optimize your posting schedule, and tailor your content to maximize engagement and reach. Whether you’re an individual creator, a small business, or a seasoned social media marketer, understanding these metrics is the foundation for building a thriving presence on X.
Want to supercharge your engagement efforts and dive deeper into trending conversations? Explore Reply Guy, a tool designed to help you identify and respond to relevant discussions, boosting your visibility and connecting with a wider audience. Reply Guy empowers you to leverage real-time Twitter engagement metrics to inform your strategy and maximize your impact on X.