
Beyond Vanity Metrics: What Engagement Actually Means Today
Likes and followers are appealing metrics to track. However, these vanity metrics don't always tell the full story of your social media performance. Today, meaningful engagement runs much deeper. It's about creating authentic connections with your audience and understanding how those interactions lead to tangible results. This means prioritizing actions that show genuine interest and investment in your content.
For example, think about the difference between a passive "like" and a well-thought-out comment. Someone who takes the time to comment demonstrates a higher level of engagement than someone who simply likes a post while scrolling through their feed. Shares, saves, and direct messages also signal a stronger connection with your brand. These actions show that your content resonated enough that users want to share it with their network or save it for later.
Several factors are driving this shift towards deeper engagement indicators, including changing algorithms and evolving user behavior. To measure social media engagement effectively, understanding the shifts in platform-specific engagement rates is vital. For example, Instagram's median engagement rate fell significantly from 2.94% in January 2024 to 0.61% by January 2025. This substantial drop highlights the changing nature of user interaction on platforms like Instagram, where engagement metrics like likes, comments, and saves are becoming less common. Declines in engagement rates across platforms like Facebook (down 36%), Instagram (down 16%), and TikTok (down 34%) suggest a broader trend of decreasing public engagement. Understanding these changes is crucial for businesses and creators looking to adapt their content strategies and maintain audience engagement. More detailed statistics can be found here: Buffer - Average Engagement Rate. This means relying only on vanity metrics can be misleading, and a more nuanced approach is necessary. You might also find this helpful: How to master Twitter analytics and understand engagement metrics.
Identifying Meaningful Engagement
So, how can you identify meaningful engagement? It begins with aligning your metrics with your specific business objectives. Are you trying to drive website traffic, generate leads, or build brand awareness? Each goal requires a different set of engagement metrics. For instance, if your goal is to increase website traffic, click-through rate (CTR) becomes a crucial indicator of success.
Even within the same metric, there are different levels of engagement. A click that leads to someone immediately leaving your website is less valuable than a click that results in a longer visit and further exploration of your content. This highlights the importance of looking past surface-level metrics and considering the entire user journey.
Platform-Specific Metrics That Actually Drive Results
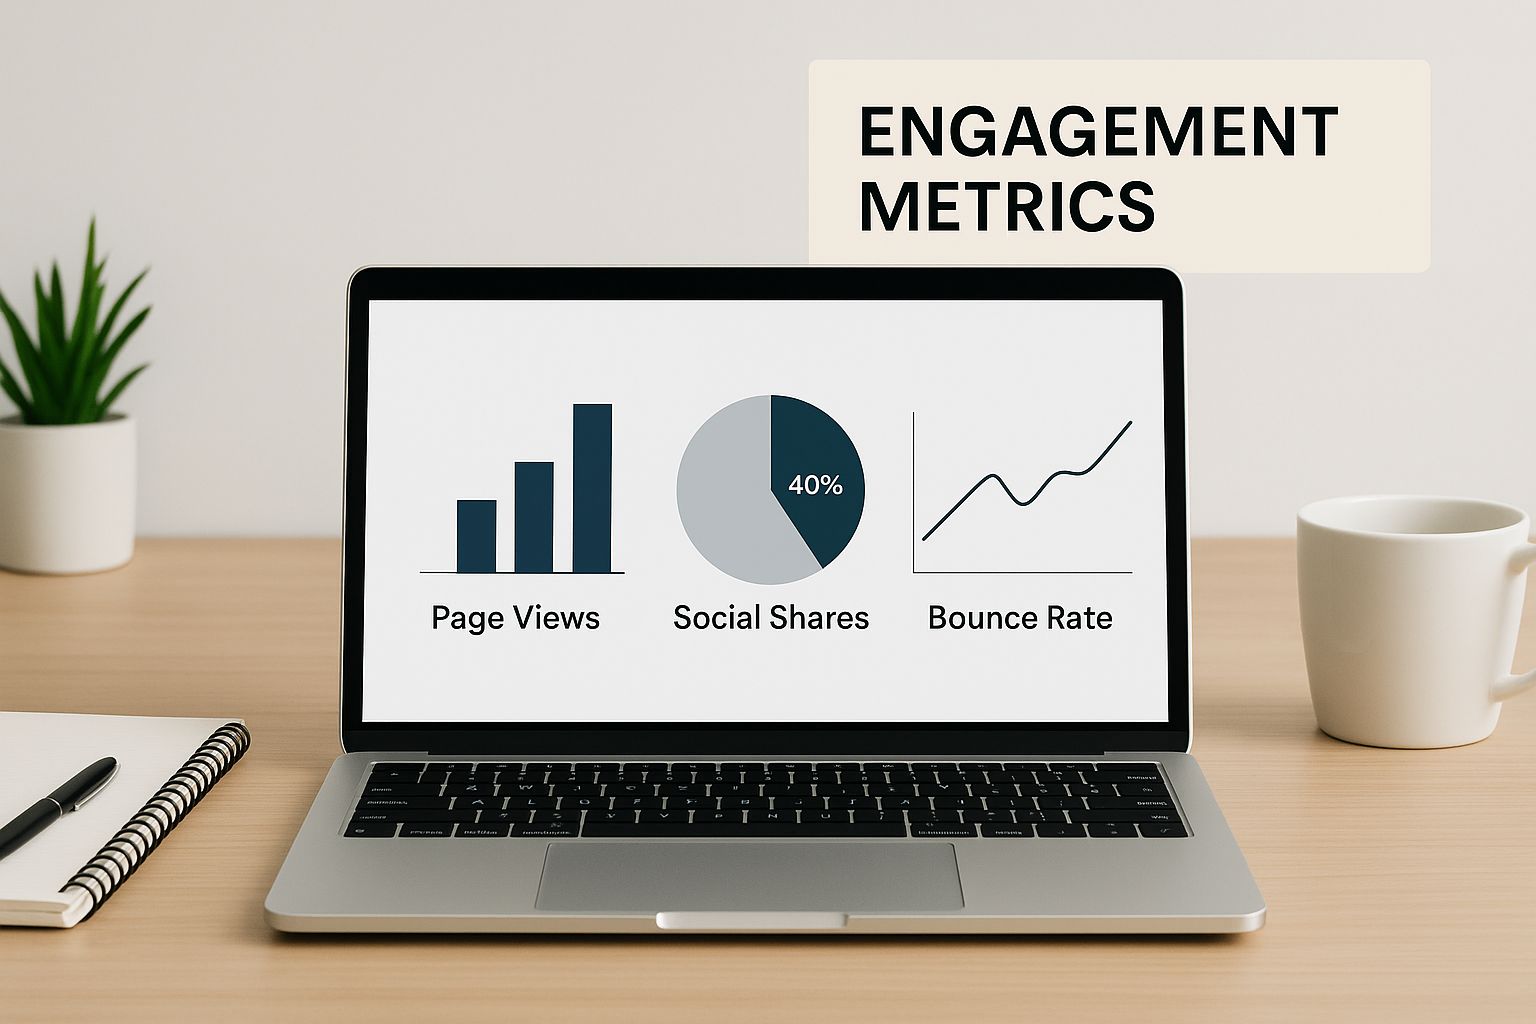
The infographic above illustrates a workspace featuring engagement metrics displayed on a laptop. This highlights the vital role visual data analysis plays in understanding social media performance. The image emphasizes that measuring engagement effectively means focusing on the right metrics, not just any metrics. This requires moving beyond vanity metrics like follower count and likes.
It's also important to remember that not all platforms measure engagement in the same way. What indicates a strong connection on Instagram might differ greatly from what drives results on LinkedIn or TikTok. Understanding these platform-specific nuances is key to maximizing impact and return on investment. For example, here are some tips to improve Twitter engagement.
Decoding Instagram Engagement
On Instagram, saves are often a stronger indicator of valuable content than likes. A like can be a quick, surface-level interaction, but a save suggests the user found the information compelling enough to revisit later. The Instagram algorithm also prioritizes content with high save rates, leading to increased organic reach. Other key metrics include story replies and sticker interactions, which show audience interest and encourage direct engagement.
Measuring TikTok Success
TikTok thrives on video completion rate. If viewers are watching your videos to the end, it tells the algorithm that your content is engaging, thus boosting its visibility. Shares and comments also play a vital role, showing that viewers resonate with your message and want to share it within their network. Duets and stitches, features unique to TikTok, represent a deeper level of engagement where users actively incorporate your content into their own creations.
LinkedIn Engagement for Lead Generation
As a professional networking platform, LinkedIn prioritizes engagement that leads to meaningful connections and lead generation. Comments and shares on insightful posts are highly valuable, showcasing your expertise and fostering discussion within your industry. Direct messages and connection requests generated from your content indicate that you're successfully building relationships and generating interest in your services or brand.
To help illustrate the varying engagement metrics across platforms, let's look at the following table:
Social Media Engagement Metrics by Platform
A comprehensive comparison of key engagement metrics across major social media platforms
| Platform | Primary Metrics | Secondary Metrics | What They Tell You |
|---|---|---|---|
| Saves, Story Replies, Sticker Interactions | Likes, Comments | Content value, audience interest, direct engagement | |
| TikTok | Video Completion Rate, Shares, Comments | Duets, Stitches | Content engagement, message resonance, user-generated content |
| Comments, Shares, Direct Messages, Connection Requests | Post Views, Likes | Thought leadership, industry discussion, lead generation |
This table highlights how different platforms emphasize various aspects of engagement. While likes and comments are important across the board, platform-specific metrics like saves on Instagram and video completion rate on TikTok provide deeper insights into audience behavior. On LinkedIn, the focus shifts to metrics that drive professional connections and business growth.
Cross-Platform Analysis
While each platform has its unique set of metrics, recognizing cross-platform patterns provides valuable insights. For instance, if your content consistently performs well on Instagram and TikTok, but underperforms on LinkedIn, it may indicate a mismatch between your content and the LinkedIn audience. This understanding allows you to refine your approach and tailor your content to each platform's characteristics and user expectations. Analyzing these patterns helps make data-driven decisions and optimize your social media strategy. This targeted approach focuses your efforts where they will be most effective, ultimately driving business growth and achieving your social media objectives.
Benchmarking Your Performance Against Reality, Not Hype

The image above shows someone analyzing social media data. It highlights the need for a realistic approach when measuring engagement. It's tempting to chase viral fame, but sustainable growth comes from understanding your performance in a realistic context. This means going beyond superficial metrics and focusing on benchmarks that truly reflect your progress.
One common mistake is comparing your engagement rates to general industry averages. These averages can be misleading, as they often ignore key factors like audience size, content type, and platform dynamics. For example, a smaller, niche account might have a higher engagement rate than a large brand with millions of followers. This can be true even if the brand generates more overall interactions.
Different industries also see different levels of engagement. A tech company launching a new product might see a surge in activity that a local bakery wouldn't.
Setting Contextual Benchmarks
Instead of aiming for arbitrary engagement rates, successful brands set contextual benchmarks. This involves considering several key factors.
Historical Data: Analyze your past performance to understand your own trends. This creates a baseline to measure future progress against.
Competitor Analysis: Research your direct competitors to see how your engagement compares to others targeting the same audience. This provides a more relevant comparison than general industry averages.
Benchmarking social media performance is crucial for businesses and marketers to understand how their content resonates with their audience. The 2025 Social Media Industry Benchmark Report by Rival IQ analyzed over 4 million posts and 9 billion likes, comments, and shares across platforms. Key findings include TikTok leading in engagement despite a decline, while carousels on Instagram outperformed Reels.
This data gives valuable insights for industries to refine their content strategies. For instance, holiday hashtags continue to deliver high engagement, while Health & Beauty struggled due to market saturation. Learn more about social media engagement trends here.
Platform Trends: Consider platform-specific trends and algorithm changes. Each platform has its own unique characteristics and audience behavior. What works on Instagram might not work on LinkedIn or TikTok. Adapting to these nuances is essential for realistic goals.
Seasonal Patterns: Be aware of seasonal factors that can affect engagement. Many industries experience peaks during holidays or special events.
To better understand industry benchmarks, let's take a look at the following table:
Average Engagement Rates by Industry
| Industry | TikTok | ||||
|---|---|---|---|---|---|
| Apparel | 0.89% | 0.27% | 5.63% | 0.045% | 0.36% |
| Food & Beverage | 0.61% | 0.21% | 4.97% | 0.038% | 0.31% |
| Health & Beauty | 0.67% | 0.19% | 4.21% | 0.042% | 0.33% |
| Technology | 0.54% | 0.23% | 6.12% | 0.048% | 0.39% |
| Automotive | 0.72% | 0.25% | 5.89% | 0.041% | 0.35% |
This table represents average engagement rates and may vary based on specific factors like audience size and content strategy.
As shown in the table, engagement rates differ significantly across industries and platforms. TikTok generally maintains the highest engagement, while Twitter consistently has the lowest. These differences highlight the importance of focusing on contextual benchmarks rather than broad industry averages.
Establishing Progressive Goals
Once you’ve established your contextual benchmarks, you can set progressive engagement goals. These goals challenge you to improve without being unrealistic. Start with small, incremental goals based on your current performance. As you reach these smaller goals, gradually increase the challenge.
This approach not only promotes sustainable growth but also boosts team morale by celebrating achievable wins. This creates a positive cycle that encourages continuous improvement and a realistic evaluation of your social media performance.
Analytics Tools Worth Your Time and Budget
After establishing your benchmarks, the next step in effectively measuring social media engagement is choosing the right analytics tools. A wide variety of options are available, from free tools provided by the platforms themselves to sophisticated third-party solutions. Understanding which tools offer real value for your specific needs is essential.
Native Platform Analytics: A Solid Starting Point
Most social media platforms provide built-in analytics dashboards. These tools offer fundamental metrics like impressions, reach, and engagement rates. They're an excellent starting point, particularly for individuals or small businesses operating with limited budgets. For instance, Instagram Insights offers a clear overview of post performance and audience demographics. Twitter Analytics similarly provides data on tweet impressions, engagement, and audience growth.
However, native analytics tools may lack the depth and customization necessary for more complex analysis. They generally do not provide cross-platform comparisons or in-depth reporting options. This limitation can make it challenging to gain a complete view of overall social media performance. For a more in-depth look at one platform's engagement strategies, check out our guide on Manual vs. Automated Twitter Engagement: A Complete Analysis. This brings us to the advantages of using third-party tools.
Third-Party Analytics Tools: Unlocking Deeper Insights
Third-party analytics tools offer advanced features, including competitive analysis, custom dashboards, and automated reporting. Popular options include SproutSocial, Hootsuite, and Buffer. These tools aggregate data from multiple social media platforms, creating a central hub for performance monitoring.
These platforms often include features like sentiment analysis, helping you understand your audience's emotional responses to your content. You can also track engagement velocity to identify momentum shifts and measure dark social sharing—activity that standard analytics typically miss. This comprehensive perspective allows for identifying improvement areas and refining your social media strategy with data-driven insights.
Choosing the Right Tool for Your Needs
Choosing the best analytics tool depends on a few key factors:
Team Size: For individual creators, native platform analytics may be sufficient. Larger teams often benefit from robust third-party solutions to manage multiple accounts and complex social media campaigns.
Budget: Free native analytics are an excellent starting point. Paid third-party tools provide more advanced features, but these come with associated costs. Consider which paid features align with your needs and budget constraints.
Analytical Needs: If basic metrics are enough, native analytics may suffice. If you need deeper insights, competitive analysis, or customized reporting, a third-party tool is likely a better investment.
Automation: Many third-party tools offer automation features, streamlining tasks like scheduling posts and generating reports. This can free up valuable time and improve overall efficiency, especially for busy teams.
By carefully considering these factors, you can choose the analytics tools that best meet your specific needs and empower you to measure social media engagement effectively. This allows you to transform data into actionable strategies for continued growth and success.
Transforming Data Into Decisions That Drive Results

The image above shows someone analyzing data, highlighting the critical role of data-driven decision-making in social media. Collecting engagement data is only the first step. You then need to transform that data into actionable strategies. This means understanding how to interpret metrics, identify patterns, and refine your approach based on these insights. To delve deeper into social media engagement, consider using tools like Google Analytics.
Identifying Patterns in Engagement Fluctuations
Transforming data into decisions starts with identifying patterns. Look beyond individual metrics and consider how they change over time. For instance, a sudden spike in engagement on a specific post warrants investigation. What contributed to its success? Was it the content, the timing, or a combination of factors? Conversely, a consistent decline in engagement might indicate a need to adjust your content strategy.
Also, consider the influence of external factors. Algorithm changes, current events, and even seasonal trends can all affect your metrics. Recognizing these patterns allows you to anticipate potential challenges and proactively adapt your strategy. For further information, see this helpful article on How to increase Twitter engagement.
Competitive Analysis: Learning From Others
Competitive analysis is another valuable tool for data-driven decisions. Analyzing your competitors’ social media performance reveals opportunities to improve your own strategy. Observe their content types, posting times, and audience responses. This provides valuable insights into industry best practices and areas for differentiation.
Focus on actionable insights. Knowing your competitor has a higher engagement rate is not enough. Understand why they are performing better and apply those lessons to your own content. This might involve experimenting with different content formats, adjusting your posting schedule, or refining your target audience.
Content Experiments Based on Data Signals
Data can also inform content experiments. If a particular content type consistently performs well, create more of it. For example, if video content consistently outperforms static images, consider increasing your video production. Similarly, if certain hashtags are driving more engagement, incorporate those into future posts.
These experiments provide concrete data for optimizing your content strategy. Continuous testing and iteration based on data signals ensure your content resonates with your audience and achieves your business goals.
Building Feedback Loops Between Metrics and Creative Direction
Establishing feedback loops between your metrics and creative direction is essential. Regularly review your analytics and use these insights to shape your content creation process. For example, if your audience engages heavily with content on a specific topic, develop a series of posts or a full campaign around it.
Also, create content optimization protocols based on engagement patterns to maximize the reach and impact of your content. This iterative process of analyzing data, experimenting, and refining your approach is key to sustainable growth and achieving your social media objectives. This continuous feedback loop keeps your content strategy aligned with audience interests and evolving trends, leading to more effective and impactful social media engagement and driving better results over time.
Advanced Engagement Measurement Beyond Surface Metrics
Going beyond basic engagement metrics like likes, comments, and shares unlocks a deeper understanding of your audience's true connection with your brand. This advanced level of measurement allows you to refine your social media strategy, optimize your content, and ultimately achieve better business outcomes. It's about moving beyond simply counting interactions and delving into the why behind the numbers. Understanding the nuances of audience behavior is key to driving impactful results.
Sentiment Analysis: Gauging Emotional Responses
Sentiment analysis goes beyond the quantity of engagement and explores the quality. It involves using tools to analyze the emotional tone of conversations surrounding your brand on social media. Are people expressing positive, negative, or neutral sentiments toward your content or brand mentions?
This understanding can help you identify potential PR crises, address customer concerns, and tailor your messaging to resonate better with your audience. For example, a sudden surge in negative sentiment around a new product launch could signal a need to address customer concerns or adjust your marketing approach.
Engagement Velocity: Identifying Momentum Shifts
Engagement velocity tracks the speed at which your content gains traction. It's not just about how much engagement you receive, but how quickly that engagement accumulates. A rapid increase in engagement suggests your content has resonated with your audience.
This presents an opportunity to capitalize on the momentum. This might involve boosting the post, running targeted ads, or creating follow-up content to keep the conversation going. Conversely, slow engagement velocity could indicate a need to revisit your content strategy or target a different audience.
Dark Social Sharing: Uncovering Hidden Engagement
Dark social sharing refers to the sharing of content through private channels like email, messaging apps, and closed communities. This type of sharing is often missed by standard Google Analytics tools, as it isn't publicly visible. However, it represents a significant portion of online engagement.
Tracking dark social sharing through custom UTM parameters allows you to measure its impact and understand which content resonates most effectively within these private networks.
Leveraging Custom UTM Parameters and Conversion Path Analysis
Implementing custom UTM parameters in your social media links provides granular tracking of your campaigns' performance across different platforms and content formats. This allows you to attribute website traffic and conversions back to specific social media efforts, offering valuable insights into which channels and posts are most effective in driving business outcomes.
Conversion path analysis sheds light on the journey users take from initial social media engagement to final conversion. This analysis helps you identify the touchpoints that influence purchasing decisions and optimize the entire customer journey. For instance, you might discover that users who engage with your Instagram stories are more likely to visit your website and make a purchase.
Weighted Engagement Scoring Systems: Reflecting Priorities
Creating a weighted engagement scoring system allows you to prioritize the metrics that matter most to your business. Not all engagements are created equal. A comment might be more valuable than a like, and a share might be more valuable than a view.
By assigning different weights to each engagement type, you can create a scoring system that accurately reflects your specific goals and priorities. This enables you to focus your efforts on the activities that truly drive results for your business.
By embracing these advanced engagement measurement techniques, you gain a more nuanced and holistic view of your social media performance. This empowers you to transform data into actionable strategies that drive real business results.
Want to accelerate your audience growth on X (formerly Twitter)? Reply Guy is a powerful Chrome extension designed to pinpoint trending tweets and help you engage strategically for maximum impact. Learn more and start growing your X audience today!