
Unlocking Social Media Success with the Right Metrics
Want faster growth and a stronger social media presence in 2025? Tracking the right social media engagement metrics is key. This listicle reveals seven essential metrics, providing actionable insights to optimize your strategy for maximum impact. Learn how to measure Engagement Rate, Reach & Impressions, Click-Through Rate (CTR), Follower Growth Rate, Amplification Rate, Comment Rate & Sentiment, and Video Engagement Metrics. Understanding these social media engagement metrics empowers data-driven decisions for organic growth and increased brand visibility.
1. Engagement Rate
Engagement rate is a crucial social media engagement metric that measures the level of interaction your content receives relative to your reach or followers. It goes beyond simply measuring how many people see your content (reach) and quantifies how actively involved your audience is with it through actions like likes, comments, shares, saves, and retweets. This metric is essential because it provides insights into content resonance and audience relationship quality, offering a more nuanced perspective than follower count alone. Why does this matter? A highly engaged audience is more likely to convert into customers, brand advocates, and long-term followers.
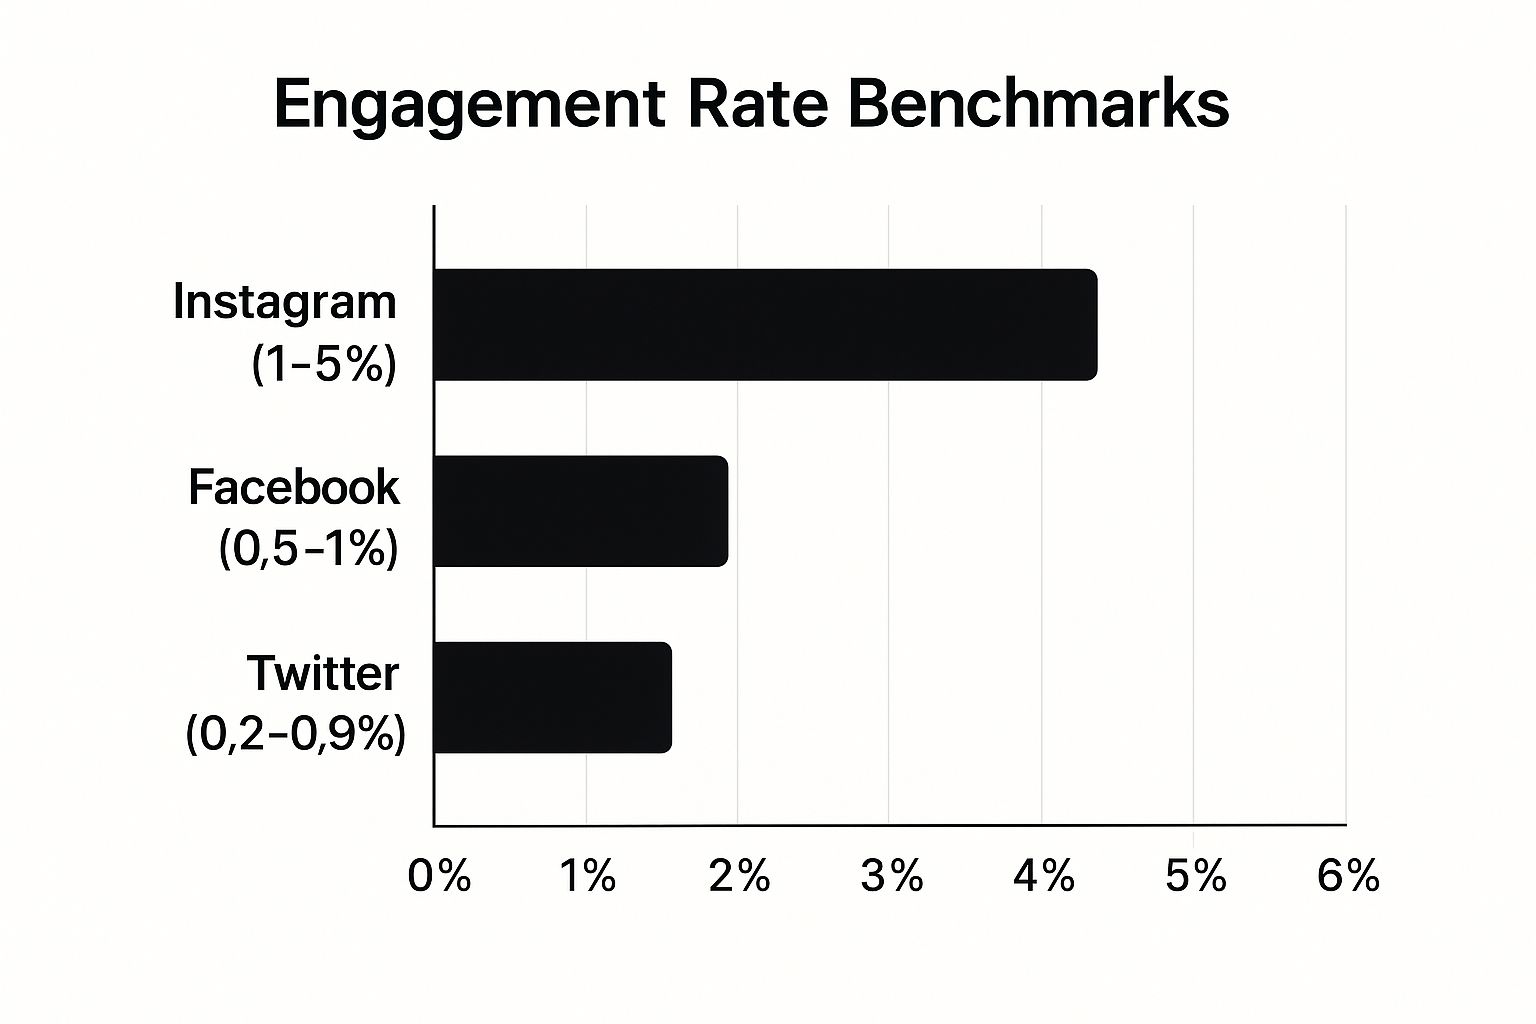
This infographic visualizes typical engagement rate benchmarks categorized by follower count on Instagram. As depicted, accounts with smaller follower counts tend to have higher engagement rates, while those with massive followings often experience lower engagement. For instance, accounts with under 1,000 followers boast an average engagement rate of 7.2%, while those with over 100,000 followers see an average of 1.1%. This emphasizes the importance of understanding benchmark ranges relevant to your account size.
Calculating engagement rate is relatively straightforward. It's typically done by dividing the total number of engagements on a post (or across multiple posts) by the total number of followers (or impressions) and then multiplying by 100 to express it as a percentage. This platform-agnostic metric works across various social networks, offering valuable performance comparisons. It can be measured per post, per campaign, or as an overall account average, providing flexibility in analysis. Engagement rate is often categorized as low (less than 1%), good (1-3%), high (3-5%), or very high (5%+), offering benchmarks for evaluation. Learn more about Engagement Rate
Pros of Tracking Engagement Rate:
- Standardized Comparison: Enables comparison of performance across different account sizes, providing a level playing field for analysis.
- Content Resonance Identification: Helps pinpoint which content types resonate most with your audience, informing content strategy.
- Relationship Quality Indicator: Offers a more valuable measure of audience relationship quality than follower count alone.
- Benchmarking: Useful for comparing performance against industry benchmarks, identifying areas for improvement.
Cons of Tracking Engagement Rate:
- Calculation Variations: Calculation methods can vary across different platforms and social media management tools, potentially leading to inconsistencies.
- Potential for Inflation: Engagement rate can be artificially inflated through engagement pods or other inauthentic tactics, skewing results.
- Lack of Qualitative Insight: Doesn't account for the quality or sentiment of engagements (e.g., positive vs. negative comments).
- Benchmark Variability: Average benchmarks can vary widely across industries and platforms, making comparisons challenging.
Examples of Successful Implementation:
- National Geographic consistently achieves engagement rates of 4-5% on Instagram despite having over 250 million followers, demonstrating the power of high-quality, engaging content.
- HubSpot reports average engagement rates of 0.76% for Facebook, 0.47% for Twitter, and 1.14% for Instagram for business accounts, providing valuable industry benchmarks.
- GoPro leverages engagement rate to identify their most compelling user-generated content, showcasing the metric's usefulness in content curation.
Actionable Tips for Using Engagement Rate:
- Segment by Content Type: Analyze engagement rate by content type (e.g., video, images, text) to identify what resonates most with your audience.
- Track Multiple Metrics: Monitor both daily engagement rate and per-post engagement rate to gain a comprehensive understanding of performance.
- Utilize Industry Benchmarks: Compare your engagement rate against industry benchmarks rather than global averages for more relevant insights.
- Analyze Trends: Look for trends in engagement rate over time rather than focusing on individual posts to identify patterns and inform long-term strategy.
Want to dive deeper into measuring your social media success? This article provides a comprehensive overview of eight essential social media engagement metrics from REACH Influencers. Engagement rate holds a significant position in this list due to its ability to reveal genuine audience interest and interaction. By focusing on fostering genuine connections and creating resonant content, you can boost your engagement rate and cultivate a thriving online community.
2. Reach & Impressions
Reach and impressions are foundational social media engagement metrics that provide insights into the visibility of your content. Understanding the difference between these two is crucial for analyzing performance and crafting effective social media strategies. Reach measures the total number of unique users who have seen your content. Think of it as the number of individual people your content has touched. Impressions, on the other hand, measure the total number of times your content has been displayed, regardless of whether it was seen by the same user multiple times. So, one person could contribute multiple impressions to a single piece of content. These metrics are essential for understanding how widely your content is being distributed and are the basis for calculating other crucial engagement metrics.
This duo of metrics is available on virtually all major social media platforms, including Facebook, Instagram, Twitter, and LinkedIn. They can be tracked at various levels – for individual posts, stories, or even for your account as a whole. Furthermore, platforms often break down reach and impressions into organic (unpaid) and paid categories, providing further insight into the effectiveness of your content promotion strategies.
Features and Benefits:
- Distinct Measurement: Reach focuses on unique viewers, while impressions represent total views, offering a nuanced view of content distribution.
- Wide Availability: Accessible on most major social media platforms.
- Granular Tracking: Measurable for individual posts, stories, and overall account performance.
- Organic vs. Paid Breakdown: Helps assess the effectiveness of paid campaigns.
Pros:
- Visibility Insights: Offers a glimpse into how many people your content is reaching, even beyond your immediate followers.
- Algorithm Impact Analysis: Helps understand how algorithm changes affect your content distribution.
- CPM Calculation: Essential for determining cost-per-thousand-impressions for paid campaigns.
- Content Distribution Analysis: Useful for understanding how your content spreads organically.
Cons:
- Engagement Disconnect: High reach doesn't guarantee meaningful engagement or interactions.
- Estimated Metrics: Platform-provided data is often estimated rather than precise.
- Verification Challenges: Difficult to independently verify the accuracy of the metrics.
- Inflated Impressions: Bot traffic or accidental views can inflate impression counts.
Examples of Successful Implementation:
- Wendy's: Their #NuggsForCarter campaign achieved billions of impressions, demonstrating the power of viral marketing to reach far beyond their existing follower base.
- Red Bull: Consistently achieves reach metrics exceeding their follower count by multiple times due to their focus on viral and shareable content.
- ALS Ice Bucket Challenge: This viral campaign generated over 10 billion impressions globally, illustrating the potential for massive reach through engaging content.
Actionable Tips:
- Track the Impression-to-Reach Ratio: This helps understand how often your audience sees your content on average. A higher ratio suggests repeated exposure to the same audience.
- Identify Optimal Posting Times: Use reach data to determine when your audience is most active and receptive to your content.
- Compare Content Formats: Analyze reach across different content types (images, videos, text) to optimize for maximum visibility.
- Monitor Organic Reach Trends: This can alert you to algorithm changes that might be impacting your content distribution.
Reach and impressions are essential social media engagement metrics for anyone looking to grow their audience and understand their content performance. While these metrics alone don't tell the whole story, they provide a valuable foundation for building a data-driven social media strategy. They deserve a place on this list because they offer a fundamental understanding of content visibility, which is the first step towards driving meaningful engagement and achieving your social media goals. They are especially crucial for X creators, marketers, small businesses, influencers, and even hobbyists who want to understand how their content is performing and identify areas for improvement.
3. Click-Through Rate (CTR)
Click-through rate (CTR) is a crucial social media engagement metric that measures the percentage of people who click on a specific link or call-to-action after seeing your social media post. It provides valuable insights into how effectively your content drives traffic away from the social media platform itself and towards your desired destination, whether that's a website, product page, landing page, or app download. This makes CTR particularly important for conversion-oriented campaigns and content strategies aiming to generate leads, sales, or other specific actions. It's a core component of understanding how your social media presence translates into tangible results.

CTR is calculated by dividing the number of clicks a post receives by the number of impressions (times the post was seen) and then multiplying by 100. This metric is often tracked using UTM parameters or platform-specific link tracking tools. It's important to remember that CTR can vary significantly depending on factors such as content type, platform, and placement of the link within your post. For instance, a visually driven platform like Instagram might yield different CTRs compared to a text-heavy platform like X (formerly Twitter).
Why CTR Deserves Its Place on the List:
CTR moves beyond vanity metrics like likes and comments, offering a more concrete measure of audience engagement. It directly reflects audience intent and interest, demonstrating that users found your content compelling enough to take the desired action. This makes CTR an essential metric for anyone serious about leveraging social media for tangible outcomes, from driving sales to generating leads to building a larger email list.
Features and Benefits:
- Direct Measurement of Intent: CTR provides a clear indication of how well your content resonates with your audience and motivates them to take action.
- Content Relevance and CTA Effectiveness: A high CTR suggests that your content is relevant to your audience and that your call-to-action is compelling and well-placed.
- Conversion-Focused Campaigns: For campaigns designed to drive conversions, CTR is a critical metric for measuring success and calculating ROI.
- Content Optimization: Analyzing CTR helps identify which content types and formats are most effective in driving traffic to your desired destinations.
Pros and Cons:
Pros:
- Directly measures audience intent and interest beyond passive engagement.
- Strong indicator of content relevance and call-to-action effectiveness.
- Critical metric for conversion-focused campaigns and ROI calculation.
- Helps identify which content types drive traffic most effectively.
Cons:
- May be artificially low for awareness-focused content without strong CTAs.
- Click fraud and bot traffic can inflate metrics.
- Platform-tracked clicks can differ from destination website analytics.
- Doesn't measure post-click behavior or the quality of the traffic.
Examples of Successful Implementation:
- Media companies like BuzzFeed have reportedly achieved CTRs of 4-5% on social media posts linking to their quizzes and listicles.
- Fashion retailers like ASOS maintain average CTRs of around 1.5% on Instagram shopping posts.
- News outlets like The New York Times have seen significant increases in CTR (e.g., 40%) by optimizing headline formats specifically for social media.
Actionable Tips for Improving CTR:
- Utilize Tracking Tools: Use URL shorteners or branded links with built-in tracking capabilities to monitor click performance accurately.
- A/B Test CTAs: Experiment with different CTA formats, placements, and language to identify what resonates best with your audience.
- Segment Your Analysis: Segment CTR by content type, time of day, and audience demographics to understand which factors influence click-through behavior.
- Ensure Consistent Messaging: Make sure the destination page experience aligns with the promise of the social media post to avoid disappointing users.
- Tailor Landing Pages: For major campaigns, create platform-specific landing pages that are optimized for conversions.
When and Why to Use CTR:
CTR is a valuable metric for anyone using social media to drive traffic and achieve specific goals. This includes:
- E-commerce brands focusing on direct social media ROI.
- Content publishers aiming to increase website traffic and engagement.
- B2B marketers using social media as a lead generation channel.
- Influencers and content creators seeking to drive traffic to their websites, online stores, or other platforms.
- Small businesses looking to expand their brand presence and drive sales through social media.
By understanding and actively monitoring your CTR, you can significantly improve the effectiveness of your social media strategies and achieve your desired outcomes.
4. Follower Growth Rate
Follower growth rate is a crucial social media engagement metric that measures the speed at which your account gains (or loses) followers over a specific period. It provides valuable insights into the effectiveness of your audience acquisition strategies and the overall health of your brand. While the absolute number of followers shows your potential reach, the growth rate indicates momentum and the trajectory of your audience development. This metric deserves its place on the list of essential social media engagement metrics because it helps you understand how well your content and strategies are resonating with your target audience and attracting new followers.
How It Works:
Follower growth rate is calculated by dividing the number of new followers gained during a specific period by the total number of followers you had at the beginning of that period, then multiplying the result by 100 to express it as a percentage. It's typically measured monthly, quarterly, or annually to analyze trends and identify patterns. For a more nuanced understanding, you can break down follower growth rate into organic (earned through content and engagement) vs. paid (gained through advertising). Critically, an accurate measurement should account for both new followers and unfollows/losses. This net growth provides a truer picture of your audience growth.
Features and Benefits:
- Trend Analysis: Track growth over time to identify successful strategies and seasonal fluctuations.
- Comparative Analysis: Compare your growth rate against past performance or industry benchmarks to gauge effectiveness.
- Strategic Decision-Making: Inform content creation, campaign planning, and audience targeting based on growth trends.
- Performance Evaluation: Assess the impact of specific content or campaigns on follower growth.
Pros:
- Indicates Brand Health: A consistently positive growth rate suggests a healthy and growing brand presence.
- Identifies Successful Strategies: Growth spikes can pinpoint content or campaigns that resonated with your target audience.
- Meaningful Comparisons: Growth rate offers a more relevant comparison between accounts of different sizes than raw follower counts.
- Realistic Goal Setting: Historical growth rate data helps establish achievable and data-driven growth targets.
Cons:
- Potential for Manipulation: Follower counts can be artificially inflated through purchasing followers or other unethical tactics.
- Doesn't Reflect Audience Quality: A high growth rate doesn't necessarily equate to a highly engaged or valuable audience.
- Natural Slowdown: Percentage-based growth naturally slows as accounts get larger.
- Platform Algorithm Influence: Algorithm changes can significantly impact growth rates regardless of content quality.
Examples of Successful Implementation:
- TikTok creator Charli D'Amelio experienced explosive growth, rising from 1 million to 50 million followers in just seven months (a staggering 5000% growth rate).
- Fitness apparel brand Gymshark maintained a consistent 10-15% monthly follower growth rate for over two years during a period of significant expansion.
- Language learning app Duolingo saw their TikTok follower growth rate jump from 5% to 20% monthly after implementing a humorous content strategy.
Actionable Tips:
- Track Alongside Engagement: Monitor follower growth rate in conjunction with engagement rate to ensure you're attracting a quality audience, not just empty numbers.
- Analyze Growth Spikes: Investigate any sudden increases in followers to identify the content or strategies that triggered the growth.
- Set Realistic Benchmarks: Base your growth goals on your account's age, size, and historical performance rather than comparing yourself to competitors.
- Monitor Unfollows: Pay attention to unfollows after posting specific types of content to identify potential audience turnoffs.
- Focus on Net Growth: Prioritize net growth (new followers minus unfollows) over gross additions for a more accurate picture of your audience growth.
When and Why to Use This Approach:
Tracking follower growth rate is essential for anyone seeking to expand their reach and influence on social media. This includes individual X creators looking for faster audience growth, social media marketers and consultants, small businesses aiming to expand their brand presence on X, influencers and content creators focused on organic growth, and even social media beginners and hobbyists wanting quick follower gains. Learn more about Follower Growth Rate. This metric is especially valuable when evaluating the success of marketing campaigns, identifying trending content, and understanding the overall health of your social media presence. By analyzing follower growth rate alongside other key social media engagement metrics, you can gain a comprehensive understanding of your audience and optimize your strategies for continued growth.
5. Amplification Rate: Measuring the Ripple Effect of Your Content
Amplification rate is a crucial social media engagement metric that reveals how often your content is shared in relation to your audience size. This metric goes beyond simple likes and comments, providing valuable insights into your content's viral potential and the level of advocacy within your audience. For X creators, marketers, and businesses aiming for organic growth, understanding and optimizing for amplification rate is essential for expanding reach and building a stronger brand presence. It deserves its place on this list of key social media engagement metrics because it directly reflects the value your audience places on your content and their willingness to associate themselves with your brand.
How It Works:
Amplification rate quantifies how effectively your content inspires followers to share it with their own networks. It’s calculated by dividing the number of shares (retweets on X (formerly Twitter), shares on Facebook/LinkedIn, regrams on Instagram, etc.) by your total followers (or the post's reach) and multiplying by 100. This provides a percentage representing the portion of your audience actively amplifying your message.
Why Amplification Matters:
Amplification is one of the most valuable forms of engagement because it organically expands your content's reach to new audiences, exposing your brand to potential followers you wouldn't reach otherwise. High amplification often correlates with content that triggers strong emotional responses, suggesting it resonates deeply with your audience. This organic reach not only saves on ad spend but also introduces your brand to a higher-quality audience—individuals predisposed to engage with your content based on the recommendation of someone they trust. This social proof can significantly influence conversion rates and build brand loyalty.
Pros:
- True Audience Advocacy: Indicates a deeper level of engagement than passive likes or comments, signifying genuine appreciation and a desire to share your message.
- Organic Reach Expansion: Extends your content's visibility without requiring additional advertising budget.
- Higher-Quality Audience Reach: Reaches potential followers who are more likely to be interested in your content due to the implied endorsement from their network.
- Social Proof & Conversions: Builds credibility and trust, potentially leading to increased conversions and sales.
Cons:
- Statistical Significance: Generally a less frequent engagement type, making it harder to achieve statistical significance, especially for smaller accounts.
- Platform Variability: Amplification rates can differ significantly across platforms. X (formerly Twitter) and Facebook may yield different results compared to Instagram or LinkedIn, which often have higher amplification rates due to their professional networking nature.
- Platform Limitations: Some platforms restrict sharing functionality or visibility, impacting overall amplification potential.
- Artificial Inflation: Contests or incentivized sharing can artificially inflate amplification rates, providing a skewed representation of organic engagement.
Examples of Successful Implementation:
- Dove's Real Beauty Sketches campaign: Achieved an amplification rate of over 3.5%, with millions of shares driving 114M+ views, showcasing the power of emotionally resonant content.
- Planters' #RIPeanut Super Bowl campaign: Saw an 11% amplification rate, significantly extending reach beyond their existing follower base by tapping into a timely cultural moment.
- Spotify Wrapped: Consistently achieves 7-8% amplification as users eagerly share their personalized music statistics, demonstrating the effectiveness of user-generated content and personalized experiences.
Tips for Increasing Amplification Rate:
- Emotional Resonance: Create content that evokes high-arousal emotions like awe, amusement, or even constructive anger.
- Sharer Value: Craft content that reflects positively on the sharer when they amplify it, making them feel like they're sharing something valuable with their network.
- Identify Super-Sharers: Recognize and engage with users who regularly amplify your content; these individuals are key to expanding your reach.
- Share-Friendly Visuals: Design visually appealing assets optimized for each platform’s sharing functionality.
- Subtle CTAs: Incorporate subtle calls to action encouraging sharing when appropriate, without being overly promotional.
Popularized By:
The concept of "amplification" as a key social metric was popularized by marketing expert Jay Baer. Its importance has been further emphasized by viral marketing experts and content strategists at brands known for highly shareable content, such as Red Bull and GoPro. By focusing on creating valuable, emotionally resonant content, and understanding the nuances of each platform, you can leverage amplification rate to significantly expand your reach and achieve meaningful growth on social media.
6. Comment Rate & Sentiment
Comment Rate & Sentiment is a crucial social media engagement metric that goes beyond superficial likes and shares to provide a deeper understanding of audience reaction. It deserves a place on this list because it offers valuable qualitative insights into how your content resonates with your audience, enabling more effective communication and community building. This metric encompasses two key components: comment rate and sentiment analysis. For those looking to accelerate audience growth and cultivate a strong online presence, understanding and leveraging Comment Rate & Sentiment is essential. Whether you're an individual creator on X, a small business, a social media marketer, or just starting out, this metric can be invaluable for informing your content strategy.
Comment rate is calculated by dividing the number of comments received on a post by the total number of followers or impressions. This reveals how frequently your audience is engaging with your content in a more substantive way than simply liking or sharing. Sentiment analysis, meanwhile, delves into the emotional tone of those comments, typically categorizing them as positive, negative, or neutral using natural language processing (NLP) techniques. Together, these two elements paint a rich picture of audience response.
Features of Comment Rate & Sentiment analysis include:
- Comment Rate Calculation: Dividing the number of comments by total followers or impressions.
- Sentiment Categorization: Utilizing NLP to classify comments as positive, negative, or neutral.
- Higher-Effort Engagement: Recognizing that commenting requires more effort than liking or sharing.
- Thread Depth Analysis: Examining not only first-level comments but also the depth of replies and discussions within comment threads.
Pros:
- Qualitative Insights: Provides richer understanding beyond quantitative metrics.
- Audience Understanding: Identifies audience concerns, questions, and enthusiasm.
- Community Building: Creates opportunities for two-way communication and fostering connection.
- Customer Service: Enables direct response to customer queries and feedback.
- Content Performance Indicator: High comment rates often suggest emotionally resonant or controversial content.
Cons:
- Sentiment Analysis Accuracy: NLP tools can struggle with sarcasm, cultural nuances, and complex language.
- Moderation Resource Intensive: High comment volumes can require significant resources for moderation and response.
- Negative Sentiment Spirals: Unmanaged negative comments can damage brand perception.
- Hijacking Risk: Comment sections can be vulnerable to trolls and off-topic conversations.
Examples of Successful Implementation:
- Wendy's: Their Twitter account famously generates 2-3x the industry average comment rate through humorous and provocative content, driving significant brand awareness and engagement.
- Glossier: By fostering an inclusive online community, Glossier achieves a consistently high positive sentiment (around 40%) in the comments section of their product launch announcements.
- Away: Conversely, Away's Instagram experienced a 70% negative sentiment spike during their 2019 company culture controversy, highlighting the importance of monitoring and managing comment sentiment.
Actionable Tips:
- Respond Regularly: Encourage continued conversation by replying to comments, showing your audience you value their input.
- Track Trends: Focus on overall sentiment trends rather than overreacting to individual negative comments.
- Early Issue Identification: Use sentiment analysis tools to flag potential PR crises or reputation issues early.
- Guide Conversation: Ask specific questions in your captions to steer comment content in a desired direction.
- Categorize Comments: Create internal categories for comments (questions, complaints, praise, suggestions) to streamline response and analysis.
Learn more about Comment Rate & Sentiment This resource provides valuable insights on how to enhance engagement on Twitter, including strategies to encourage more replies.
By effectively utilizing Comment Rate & Sentiment analysis as part of your broader social media engagement metrics strategy, you can gain invaluable insights into your audience, refine your content approach, and build a stronger online community. This metric allows you to move past vanity metrics like likes and followers, and truly understand how your content is being received and how to maximize its impact. This is particularly important for those seeking faster audience growth and enhanced brand presence on platforms like X, where understanding and responding to audience sentiment is crucial.
7. Video Engagement Metrics
Video engagement metrics are crucial social media engagement metrics for understanding how your audience interacts with your video content. As video continues to dominate social media feeds, these specialized metrics provide invaluable insight into audience attention and overall content performance, going far beyond the basic engagement metrics of likes and shares. They are essential for anyone seeking faster audience growth, from individual creators and influencers to social media marketers and small businesses.
What are Video Engagement Metrics and How Do They Work?
Unlike static posts, video content offers a richer set of engagement metrics. These include:
- View Counts: While seemingly straightforward, view count definitions vary across platforms. A "view" might be registered after just 3 seconds on Facebook, but requires 30 seconds on YouTube. Understanding these nuances is crucial for accurate cross-platform analysis.
- Watch Time/View Duration: This metric measures the total accumulated minutes viewed across all viewers. Higher watch times generally signal more engaging content.
- Retention Rate: This crucial metric tracks the percentage of viewers who remain at each point throughout the video. Dips in retention highlight areas where viewers lose interest.
- Completion Rate: This indicates the percentage of viewers who watch the entire video. A high completion rate suggests compelling content that holds audience attention.
Why Video Engagement Metrics Matter
Video engagement metrics offer a deeper understanding of audience behavior and content quality than metrics for static posts. They help pinpoint exactly where viewers lose interest or re-engage, enabling creators to optimize their video length, structure, and storytelling for maximum impact. This is especially critical for platforms prioritizing video content like TikTok, Instagram Reels, and YouTube.
Pros:
- Provides deeper insights into audience attention span and content quality.
- Helps optimize video length and structure for maximum engagement.
- Identifies specific points of viewer drop-off and re-engagement.
- Essential for success on video-centric platforms.
Cons:
- Inconsistent view count definitions across platforms hinder cross-platform comparisons.
- Autoplay can inflate view counts without reflecting genuine interest.
- Often requires platform-specific analytical tools.
- High video production costs necessitate careful optimization based on these metrics.
Examples of Successful Implementation:
- Khaby Lame: TikTok's algorithm, which heavily weights average watch time, propelled Khaby Lame to over 70 million followers with simple yet highly watchable content.
- Dollar Shave Club: Their viral launch video achieved an exceptional 80% retention rate for a 90-second ad, demonstrating the power of engaging storytelling.
- GoPro: GoPro’s most successful Instagram videos maintain average view times of 25+ seconds, five times the platform average, by showcasing dynamic and visually appealing content.
Actionable Tips for Leveraging Video Engagement Metrics:
- Front-load Key Messages: Place key information and hooks within the first 3-10 seconds to capture attention immediately.
- Analyze Retention Graphs: Study retention graphs to identify specific moments where viewers drop off and adjust your content accordingly.
- Optimize for Sound-Off Viewing: Use captions and compelling visuals to engage viewers even without audio.
- Tailor Video Length to Platform: Test different video lengths on each platform instead of using a one-size-fits-all approach.
- Strategic Call-to-Actions: Include calls-to-action at points of high engagement throughout the video, not just at the end.
Popularized By:
- YouTube's detailed Creator Studio analytics.
- Facebook's shift towards prioritizing "meaningful interactions" with video content.
- TikTok's algorithm heavily weighting watch time and completion rates.
By understanding and effectively leveraging video engagement metrics, you can significantly improve your content strategy, boost audience engagement, and achieve greater success on social media platforms. These metrics are not just numbers; they are a roadmap to creating more impactful and resonant video content.
7 Key Social Media Engagement Metrics Comparison
| Metric | Implementation Complexity 🔄 | Resource Requirements ⚡ | Expected Outcomes 📊 | Ideal Use Cases 💡 | Key Advantages ⭐ |
|---|---|---|---|---|---|
| Engagement Rate | Moderate – requires tracking engagements and follower/impression data across platforms | Low to Moderate – uses existing platform data | Indicates audience interaction quality and content resonance | Measuring audience involvement and content performance comparison | Standardized comparison across accounts; valuable audience quality indicator |
| Reach & Impressions | Low – generally provided by platforms | Low – data mostly available natively | Measures content visibility and total views | Awareness and distribution optimization | Insights into potential audience size; essential for CPM and algorithm tracking |
| Click-Through Rate (CTR) | Moderate – requires precise link tracking and attribution | Moderate – tracking tools needed for UTM/link monitoring | Measures traffic driven beyond social platform | Conversion-focused campaigns and content traffic measurement | Direct indicator of audience intent and CTA effectiveness |
| Follower Growth Rate | Low to Moderate – follower counts over time | Low – platform analytics suffices | Shows audience acquisition speed and momentum | Audience growth monitoring and brand health | More meaningful than raw follower counts; helps set realistic benchmarks |
| Amplification Rate | Moderate – tracking shares relative to audience | Moderate – needs share data collection | Measures viral potential and audience advocacy | Evaluating shareability and brand affinity | Expands organic reach; strong signal of true audience engagement |
| Comment Rate & Sentiment | High – requires comment tracking and NLP sentiment analysis | High – tools for sentiment and moderation necessary | Provides qualitative feedback and emotional tone | Community management and reputation monitoring | Deep audience insights; enables two-way communication |
| Video Engagement Metrics | High – platform-specific metrics and detailed video analytics | High – video production and analytical tools required | Evaluates viewer attention and video performance | Video content optimization and platform prioritization | Detailed insights into viewer retention and content effectiveness |
Elevate Your Social Media Game with Reply Guy
Mastering social media engagement metrics—from engagement rate and reach to follower growth and video views—is crucial for anyone looking to expand their presence on X. Understanding these key performance indicators (KPIs) provides invaluable insights into what resonates with your audience, allowing you to refine your content strategy for optimal performance. By analyzing metrics like click-through rate (CTR), amplification rate, and comment sentiment, you can identify high-performing content and tailor your approach to maximize impact. This data-driven approach is the cornerstone of sustainable growth on any social media platform.
The most important takeaway here is that data empowers you. By tracking and analyzing your social media engagement metrics, you can move beyond guesswork and make informed decisions that drive real results. This translates to faster audience growth, increased brand visibility, and a stronger connection with your followers. However, staying on top of trends and engaging with relevant conversations in real-time can be challenging.
That's where Reply Guy comes in. This powerful Chrome extension helps you identify trending tweets and engage with them quickly and efficiently, maximizing your chances of riding the viral wave. By leveraging Reply Guy's real-time analysis and customizable filters, you can pinpoint high-performing content relevant to your niche and engage with a wider audience. This proactive approach, coupled with a deep understanding of your social media engagement metrics, is the key to unlocking exponential growth on X. Ready to transform your X strategy and watch your follower count soar? Install Reply Guy today from Reply Guy and start engaging smarter, not harder, by leveraging real-time insights to boost your key social media engagement metrics.