
Making Sense of Your Twitter Analytics Dashboard
Let's be honest, the Twitter analytics dashboard can be a bit of a beast. But trust me, once you get the hang of it, it’s like having a cheat code for Twitter growth. I've seen firsthand how powerful it can be, and I'm here to help you cut through the noise and focus on what truly matters.
Forget trying to decipher every single metric. Instead, concentrate on these three key areas: Tweet activity, Video activity, and Audience insights. These are your gold mines.
Tweet activity gives you the lowdown on how each of your tweets performs. This is where you see what's hitting the mark with your audience and what's falling flat. Video activity, as you might guess, dives into the specifics of your video content. Think retention rate, completion rate – the juicy details that tell you how people are really interacting with your videos. And finally, audience insights pull back the curtain on your audience demographics and behavior. It’s like getting a sneak peek into who you're actually talking to.
The screenshot above shows the main Twitter analytics dashboard. It's a quick snapshot of your account's performance, showing key metrics like impressions, engagements, and follower growth right up front. From there, you can click through to those key areas we just talked about for a more granular view. Think of it as a home base for your Twitter account analytics.
I remember working with a client who had tons of impressions, but their engagement was practically nonexistent. Digging deeper into their tweet activity, we realized their hashtags were way too broad. They were reaching a huge audience, sure, but not the right audience. We refined their hashtag strategy to be more targeted, and within a month, their engagement jumped by 20%. That's the power of understanding your data.
Customizing Your View
One thing I can’t stress enough is the importance of customizing your dashboard. Don’t get bogged down by metrics that don’t align with your goals. If you're after brand awareness, focus on impressions and reach. If you want to drive traffic to your website, click-through rates are your best friend.
This targeted approach not only saves you time but also gives you the most relevant insights. You’ll start to see what you need to track daily versus monthly and even spot those early warning signs that your Twitter strategy needs a tweak.
To help you navigate the dashboard like a pro, I’ve put together a handy guide:
Twitter Analytics Dashboard Navigation Guide: A comprehensive overview of dashboard sections and their primary functions
| Dashboard Section | Key Metrics | Primary Use Case | Update Frequency |
|---|---|---|---|
| Tweet activity | Impressions, engagements, retweets, likes | Analyzing individual tweet performance, identifying top-performing content | Real-time/Daily |
| Video activity | Video views, completion rate, retention rate | Evaluating video content effectiveness, understanding audience viewing habits | Daily |
| Audience insights | Demographics, interests, follower growth | Defining target audience, tailoring content to resonate with followers | Daily/Weekly |
This table breaks down the core sections, the key metrics within each, and how often they update. Use this as your roadmap to quickly find the information you need. By focusing on these key sections and customizing your view, you can unlock the full potential of your Twitter analytics and really start to see results.
The Metrics That Actually Matter for Growth

Let's be honest, a huge follower count might stroke your ego, but it doesn't necessarily translate to success. It's like having a packed stadium where everyone's silent – looks impressive, but lacks real energy. Engagement rate is where the magic happens. This tells you if your audience is actually vibing with your content.
I've personally seen accounts with millions of followers barely scrape a few likes, while smaller, highly engaged communities are thriving. Why? Because they're focused on connection, not just numbers. To get a better handle on your overall content performance, check out this piece on measuring content performance. It offers some great insights.
Beyond Vanity: Looking at Reach and Impressions
Don't get too hung up on impressions alone. They can be misleading. Reach, on the other hand, gives you a clearer picture of how many individual people are seeing your tweets. Impressions can be inflated by the same users seeing your tweets multiple times, which doesn't necessarily mean your message is spreading further.
For example, a tweet with 10,000 impressions could reach only 2,000 users if each user saw it five times. Reach helps you understand the true breadth of your audience. Another key metric is click-through rate. This often overlooked gem tells you how effective your content is at driving traffic to your website, landing page, or another profile. A high click-through rate means your tweets are not only engaging, but they're also prompting action. Here’s a helpful guide on understanding Twitter engagement metrics.
The Big Picture: Monetizable Daily Active Users
Speaking of reach, it's worth considering the financial implications of Twitter's user base. As of 2025, Twitter boasts 206 million monetizable daily active users (mDAU) globally. That's a lot of potential eyeballs for your content, and it's a crucial factor for Twitter's ad revenue. The US accounts for about 18% of these users. You can find more interesting stats here. Bottom line: Focusing on the right metrics – engagement rate, reach, and click-through rate – will give you a much more accurate view of your Twitter performance and help you craft a winning content strategy.
Understanding Your Audience Like Never Before
Your Twitter analytics dashboard is like a secret weapon, but so many people just glance at the follower count and call it a day. Sure, demographics are interesting, but the real gold is buried deeper – in the behavioral patterns and engagement timings. I've spent a lot of time digging into successful accounts, and trust me, there’s a big difference between followers who actually engage with your content and those who are just along for the ride (or are bots!).
I remember consulting for a small business that was totally fixated on their follower count. Their Twitter analytics showed a decent following, but their engagement was practically non-existent. When we dug deeper, we discovered that a huge chunk of their followers were inactive or bots. So, we changed their strategy to focus on attracting high-quality followers through targeted content and genuine interactions. The result? Fewer followers, but way more engagement and actual business results.
This brings me to something super important: location data and device preferences. Knowing where your audience is located can help you tailor your campaigns, while device preferences tell you how to format your content. Are your followers mostly on mobile? Keep your tweets short, sweet, and visual. Mostly desktop users? Longer, more in-depth threads might be a better fit. These little things really do make a difference. Speaking of audience size, X (formerly Twitter) has over 611 million monthly active users as of 2025! It's a huge platform with a diverse audience, making it a powerful tool for reaching potential customers. Discover more insights about X.
Finally, understanding follower quality is key to predicting long-term growth. Pay attention to trends in engagement, retweets, and replies – these are signs of a healthy, active audience. Using the interest categories within your Twitter analytics can help you refine your content calendar and even pinpoint the best times to post (something a lot of analytics tools get wrong). By segmenting your audience and tailoring your approach, you can seriously boost engagement and build a thriving community.
Transforming Data Into Winning Content Strategy
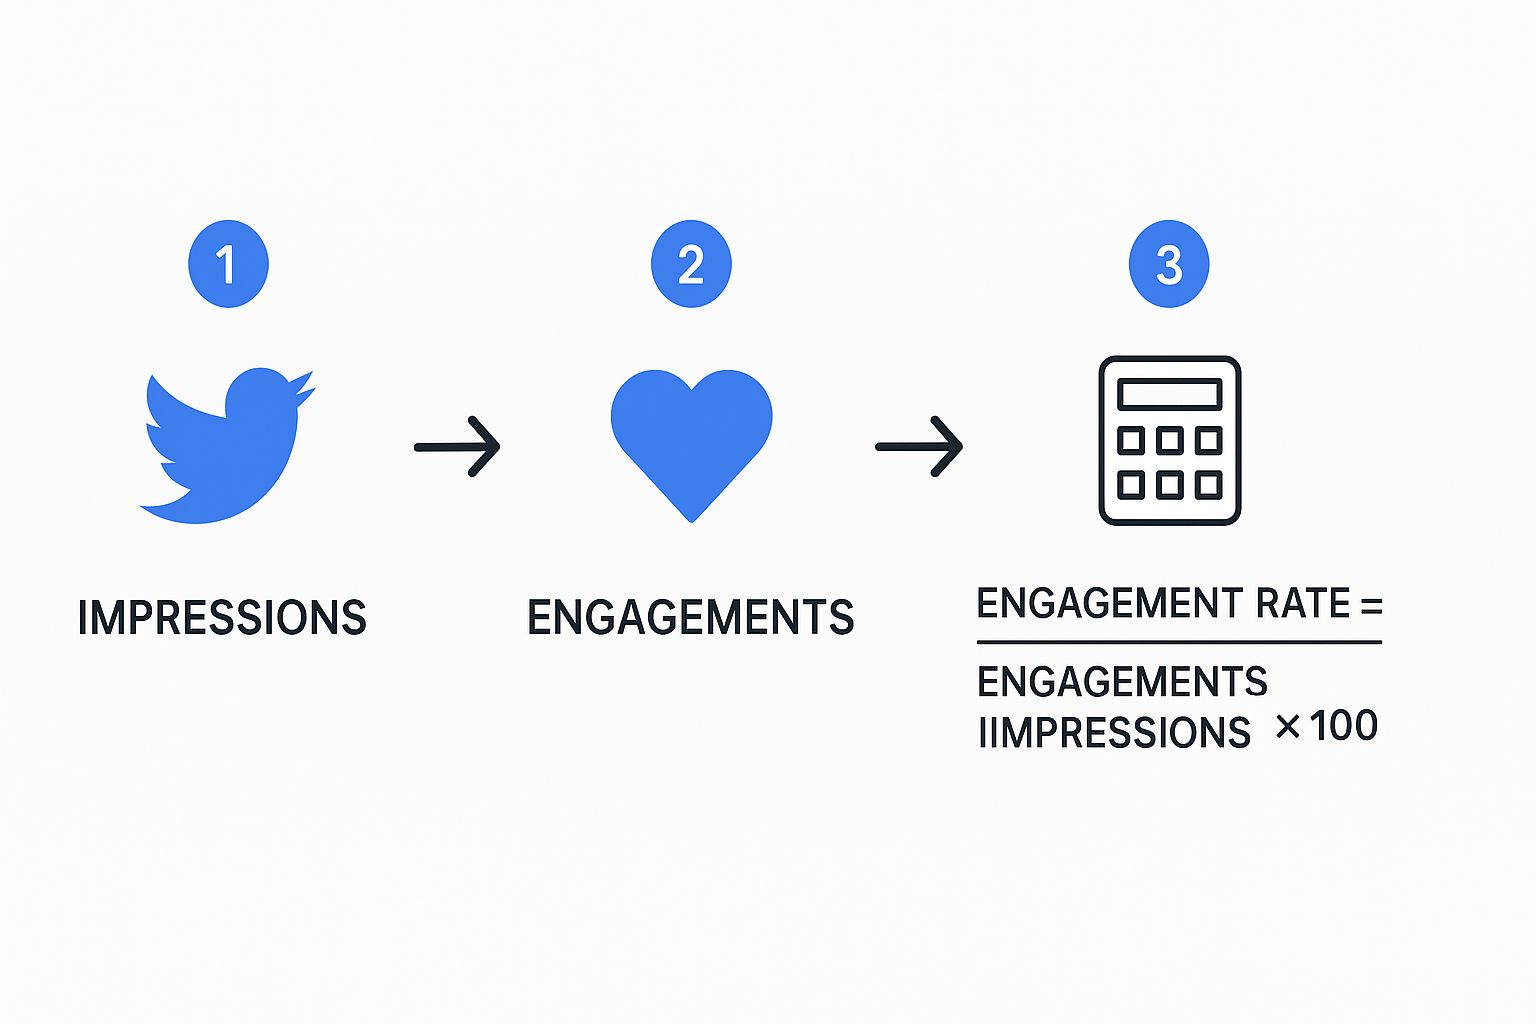
This infographic breaks down how to calculate your Twitter engagement rate: Impressions, Engagements, and the final calculation (Engagements / Impressions × 100). It’s a simple formula, right? But the insights you can unlock are seriously powerful. If your engagement rate is looking a little sad, it might be time to rethink your content or when you're posting.
Let's dive into how to turn that data into content gold. It's not enough to just look at the numbers; you need to understand the why behind them. In my experience working with creators, a data-driven approach can be the difference between a struggling account and a thriving online community. One of the biggest game-changers? Reverse-engineering your top-performing tweets.
What made those tweets take off? Was it the topic, the format, the timing? Find the common threads and create more of that magic.
For example, I worked with a client whose Twitter account analytics revealed something surprising: their short, witty tweets consistently outperformed their longer, more informative posts. This was a huge aha moment! They shifted their focus, doubling down on the short-form content, and saw their engagement skyrocket. They also realized that posting at specific times correlated with higher engagement, which helped them optimize their content calendar for maximum reach. You might find our Twitter growth guide for strategic replies helpful, too.
Identifying Content Gaps and A/B Testing
Another crucial piece of the puzzle is identifying content gaps. What are your competitors missing? What questions are your followers asking that are going unanswered? Your Twitter account analytics can help you uncover these golden opportunities. Once you have some ideas brewing, don’t be afraid to A/B test. Play around with different content types, hashtags, and posting times.
In my experience, regular A/B testing is non-negotiable for long-term growth. It helps you stay agile and adapt to algorithm changes. Remember, data isn't static. It's constantly changing, and your strategy should, too.
Content Calendar Templates and Hashtag Strategy
I always recommend using content calendar templates to my clients. It’s a lifesaver for staying organized and making sure you’re consistently putting out high-quality content. Plus, it makes tracking progress and identifying what’s working so much easier.
Another key area? Hashtag strategy. Don’t just sprinkle random hashtags on your tweets and hope for the best. Use your Twitter account analytics to pinpoint relevant, high-performing hashtags that will actually connect you with your target audience. This is where data meets creativity. By using analytics to inform your content strategy, you’re setting yourself up for consistent, sustainable growth on Twitter.
To help you systematically analyze your tweet performance and extract those valuable insights, I've put together a framework:
Content Performance Analysis Framework: Step-by-step process for analyzing tweet performance and extracting actionable insights
| Metric Category | Analysis Method | Key Questions | Action Items |
|---|---|---|---|
| Impressions | Track over time, compare to benchmarks | Are impressions increasing or decreasing? Which tweets got the most impressions? | Adjust posting frequency, experiment with different content formats. |
| Engagements (likes, retweets, replies) | Analyze engagement rate per tweet, identify top performing tweets | Which tweets generated the most engagement? What type of content resonates most with my audience? | Create more content similar to top performers, respond to comments and engage with followers. |
| Follower Growth | Monitor follower count over time, analyze follower demographics | Is my follower count growing? Who are my new followers? | Run targeted follower campaigns, engage with relevant communities. |
This framework helps you break down your Twitter analytics into actionable steps, so you can continuously refine your content and connect with your audience more effectively. Remember, it's all about understanding the story behind the numbers and using that knowledge to create even better content.
Advanced Analytics Techniques for Serious Marketers

Want to take your Twitter analytics to the next level? Sure, basic metrics are fine for a start, but if you're serious about marketing, you need to dig deeper. I'm talking about getting a real competitive advantage. One of the best ways to do this is with conversion tracking. Clicks are good, but what happens after the click is what really matters. Are those clicks turning into leads, sign-ups, or sales? That's the data that shows the real ROI of your Twitter activity.
Another incredibly useful tool? UTM parameters. These little tags you add to your links are like tiny spies, telling you exactly where your website traffic is coming from. Which tweets are driving the most valuable visitors? Which campaigns are actually performing? UTM parameters give you those answers. And while we're talking tools, don't forget the power of a good social media content creation tool to boost your workflow.
Cohort Analysis and Micro-Trends
Now, let’s get a bit more sophisticated with cohort analysis. This lets you analyze groups of followers with common traits, like when they followed you or how they engage. For example, you might discover that followers from a particular campaign are more valuable over time than organic followers. That’s the kind of detail that helps you optimize for long-term success. Speaking of engagement, this is a great resource: Read also: Twitter Engagement Metrics.
In my consulting work, I've seen firsthand how powerful spotting micro-trends can be. Keeping a close eye on your Twitter analytics can reveal small shifts in audience behavior, emerging hashtags, or what your competitors are doing before anyone else notices. This lets you adapt quickly and jump on opportunities others miss.
Custom Dashboards and Third-Party Tools
Custom dashboards can be a lifesaver. They automate your reporting and save you tons of time. Focus on the metrics that really matter to your business and set up alerts for any big changes. And don't overlook third-party tools. There are some great ones out there that work alongside Twitter's built-in analytics without breaking the bank. They can offer deeper analysis, competitor tracking, and more advanced reporting. Look, I know putting these advanced strategies into action takes work, but the insights you get are priceless. It's the difference between guessing and knowing what works on Twitter.
Solving Common Analytics Headaches
Let's be honest, Twitter analytics can be a real head-scratcher. I've worked with plenty of clients, even seasoned marketing pros, who find themselves staring blankly at their Twitter dashboards, wondering what it all means. One minute your third-party tool is telling you one thing, the next minute Twitter itself is showing something totally different. It can feel like you're chasing your tail. I'm here to help you make sense of the chaos.
One of the biggest culprits I see is the data refresh rate issue. Your third-party social media management tools might not be updating as frequently as Twitter's native analytics. That’s why you’re seeing those discrepancies. It’s totally normal to have slight variations, so don't freak out! Another common source of confusion is mixing up organic and promoted content metrics. Make sure you're looking at the right data set to get the insights you actually need. If you’re working on boosting engagement, you might find our guide on how to increase Twitter engagement helpful.
Data Discrepancies and Missing Information
Missing data or delayed reporting? Yeah, I’ve been there. It can feel like the analytics gods are against you, but usually, there’s a simple explanation. First things first, double-check your date ranges. It sounds obvious, but you’d be surprised how often a quick filter adjustment fixes the problem. If data is legitimately missing, take a look at Twitter's status page. Outages do happen, and it's better to know if there's a wider issue before you go down a rabbit hole of troubleshooting. Another thing to keep in mind: public versus private metrics. You won't have access to certain data points, like impressions on individual tweets from other accounts. That's just how Twitter rolls.
For those of you serious about your Twitter game, understanding techniques to bypass AI detection can be beneficial. Knowing how to avoid triggering AI content filters can come in handy if you're experimenting with automation tools for posting or engagement. Finally, remember to stay adaptable. Twitter likes to change things up every now and then, and these interface updates can sometimes mess with your analytics setup. Staying on top of these changes, as annoying as it can be, helps ensure your data remains consistent and reliable. Trust me, a little proactive tweaking can save you a lot of headaches down the road.
Your Twitter Analytics Action Plan

Let's talk about turning your Twitter data into a real, working system that gets results. I'm going to walk you through the weekly and monthly review process I use with my clients—it's super quick but packed with insights. First, forget about dreaming up unrealistic growth targets. We're focusing on practical goals based on your current Twitter account analytics. For example, if your engagement rate is at 1% right now, aiming for 1.5% next month is a smart, achievable step.
Setting Up Accountability and Warning Systems
Accountability is key. It doesn't have to be complicated; a simple weekly reminder to check your analytics or sharing your progress with a friend can work wonders. The important thing is to stay consistent. Next, let's set up some early warning systems. This is about identifying which metrics, if they suddenly drop, tell you something's off with your strategy. Maybe your click-through rate tanks, or your reach takes a dive. Those are red flags. Here's a Twitter growth checklist I've found useful for maintaining consistent engagement – it might help you too.
Practical Templates and Content Audits
I'm a big fan of simple tracking methods. A basic spreadsheet or even a notebook where you jot down your key metrics each week can be incredibly powerful. Regular content audits are also game-changers. Take a look at your top-performing tweets and look for trends. What grabbed your audience’s attention? What didn't work? This is gold for planning your future content and staying on track. This isn't just random advice; it's a whole plan to turn your Twitter analytics into real business growth. By tracking specific milestones, you'll clearly see the results of your efforts.
Want to seriously boost your Twitter presence? Reply Guy is fantastic for finding and engaging with trending tweets – give it a try and watch your audience grow!