
So, you want to figure out what's really working on your Twitter account. It’s easy to get caught up in the vanity metrics—chasing followers and likes—but a proper analysis goes much deeper. It’s about understanding the story behind the numbers and turning that insight into a real strategy for growth.
Why Bother Analyzing Your Twitter Account?

Let's get one thing straight: a deep dive into your Twitter (now X) analytics is the bedrock of smart growth. It turns your account from a simple megaphone into a powerful feedback loop, showing you exactly what resonates with your audience.
When you analyze your account with intention, you stop throwing content at the wall to see what sticks. Instead, you start making decisions based on actual data. This process reveals which formats—threads, polls, videos, or simple text posts—are catching fire. You’ll pinpoint the best times to post for maximum visibility and discover the specific topics that actually get people talking.
Gaining a True Strategic Edge
This isn't just about boosting your impression count; it's about attracting the right kind of attention. A thorough audit is your key to:
- Sharpening Your Content Strategy: Double down on your high-performing content pillars and confidently ditch what's falling flat. This focuses your energy where it counts.
- Getting to Know Your Audience: Find out who your most active followers are, where they live, and what other accounts they're interested in.
- Boosting Real Engagement: Learn what truly drives replies, reposts, and link clicks, so you can craft tweets that demand interaction.
The sheer size of the platform makes this more critical than ever. With X reporting over 500 million monthly active users in early 2025, the potential reach is massive. That’s a huge jump from the 217 million daily active users reported back in late 2021. It's a crowded space, but one filled with opportunity if you know what you're doing. You can dig into more data about X's user statistics to see the full picture.
To kick things off, it helps to have a clear framework. Here’s a quick breakdown of what you should focus on when you start digging into your account's performance.
Core Components of a Twitter Account Analysis
| Analysis Area | Primary Goal | Key Metrics to Watch |
|---|---|---|
| Profile & Bio | Optimize first impressions and clarity | Follower-to-following ratio, bio clarity, pinned tweet engagement |
| Content Performance | Identify what resonates with your audience | Engagement rate, impressions per tweet, replies, reposts, clicks |
| Audience Demographics | Understand who you're talking to | Follower location, interests, gender, other followed accounts |
| Posting Cadence | Find the sweet spot for visibility | Best days/times to post, tweet frequency vs. engagement |
| Community Health | Gauge the quality of your interactions | Sentiment of replies, reply-to-impression ratio, community growth rate |
Think of this table as your starting checklist. It ensures you're looking at your account from every important angle, not just the obvious ones.
A great account analysis shifts your role from being a passive user to an active strategist. You learn to speak your audience's language, anticipate what they care about, and build a community that genuinely values what you have to say.
Ultimately, taking the time to properly analyze your Twitter account gives you a clear roadmap to building sustainable influence and making real connections on the platform.
Setting Goals That Actually Drive Your Strategy
Jumping into your analytics without a plan is like wandering into a maze blindfolded. You'll stumble across plenty of numbers and charts, but you'll have no idea which way to go. Before you even think about auditing your Twitter/X account, you have to be crystal clear on what success actually looks like for you.
What's the end game here? Are you trying to funnel people to a new product page, or is your mission to become the go-to expert in your field? These are two very different objectives, and they demand you track entirely different sets of data.
Matching Metrics to Your Mission
It’s easy to get caught up chasing vanity metrics. We’ve all been there, watching the likes and follower count tick up. While those numbers can feel great, they often don't connect to what really matters—your business results. The key is to link your chosen key performance indicators (KPIs) directly to your high-level strategy.
Let's break it down:
- Building Brand Awareness? If you just want more eyeballs on your brand, then impressions, reach, and profile visits are your North Star. Your job is to show up in front of as many relevant people as you can.
- Driving Website Traffic? Here, it's all about link clicks and click-through rate (CTR). These numbers tell you exactly how good your content is at getting people to leave X and head to your website or landing page.
- Growing a Community? To see if you're building a real tribe, you need to watch your replies, reposts, and overall engagement rate. This is where you measure genuine conversation and connection.
Think about it this way: A B2B software company hunting for leads will care immensely about the quality of replies and the number of profile visits from potential clients. On the other hand, an e-commerce brand launching a new sneaker line will be obsessed with link clicks pointing to their online store.
The most powerful analysis isn't about collecting data; it's about collecting the right data. Choosing KPIs that align with your core business objectives turns your analytics from a simple report card into a powerful strategic compass.
This focused approach helps you sidestep some of the most common traps people fall into. To make sure you're starting on the right foot, it’s worth reviewing these common Twitter growth mistakes to avoid. Your goals are the foundation—they inform every single tweet, reply, and piece of content you create, ensuring nothing you do is a waste of time.
Picking the Right Tools for Your Twitter Analysis
You can't really get a grip on your account's performance without the right tools. The good news? You don't need a huge budget to start digging into the data. Your first stop should always be the platform's own free dashboard.
Before you even think about third-party apps, you need to master how to see Twitter analytics directly on X. This is your most direct source of truth, showing you exactly how your content is performing. It's the foundation, giving you the raw numbers on impressions, profile visits, and which of your tweets are actually hitting the mark.
This process isn't complicated. It’s about turning basic data points into smart actions.
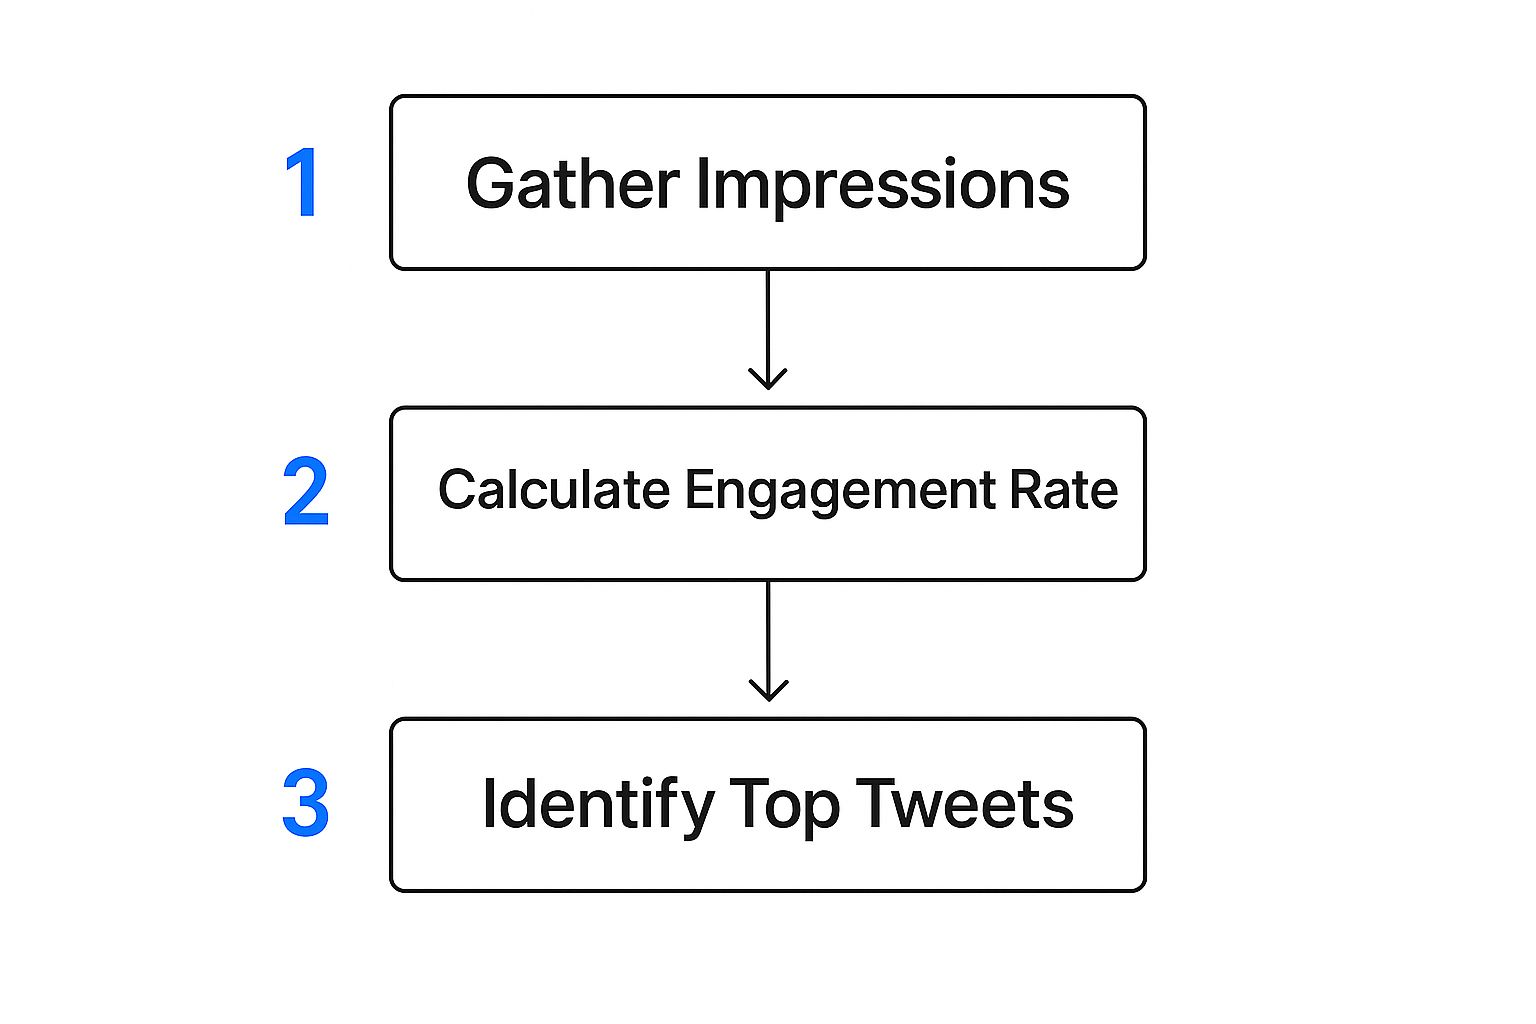
The chart above really breaks it down: you gather impression data, figure out your engagement rate, and then pinpoint the specific tweets that drove those results. It’s a simple but powerful feedback loop.
Expanding Your Toolkit
While Twitter's built-in analytics are a fantastic starting point, they do have their limits. You won't get a deep dive into what your competitors are doing or a detailed breakdown of your audience. For that, you’ll want to explore third-party tools like Sprout Social, Hootsuite, or Fedica. These platforms offer much richer features.
With these tools, you can:
- Track Competitors: See what's working for others in your space and learn from their successes (and mistakes).
- Analyze Follower Demographics: Get a crystal-clear picture of who you're actually talking to.
- Monitor Sentiment: Go beyond simple likes and see if the conversation around your brand is positive, negative, or neutral.
A smart analytics stack combines the free, foundational data from X's own dashboard with the deeper, comparative insights from a specialized third-party tool. This gives you a complete picture of your account's health and opportunities.
For example, understanding audience demographics can be a game-changer. While the U.S. is the biggest market on X with over 111 million users, Japan's user base of nearly 76 million accounts for an astonishing 60% of its population. That kind of regional engagement is something you'd only uncover with deeper data.
Ultimately, building a complete view of your data is what matters. Our guide on using your own Twitter account analytics can walk you through how to turn these numbers into real, sustainable growth.
Turning Raw Data Into Actionable Insights
 Data is just noise until you find the story it’s trying to tell. This is where the real work begins—connecting the dots between the numbers you’ve gathered and the goals you’re trying to hit. Think of your analytics dashboard as a collection of clues; your job is to play detective.
Start by hunting for patterns, trends, and anything that stands out as unusual. Don't just glance at the surface-level metrics. You need to dig in and figure out why some tweets took off while others just fizzled out.
For instance, did that sudden engagement spike come right after you replied to a major account in your niche? Or did that weird dip in impressions happen on a day you posted at 5 PM instead of your usual 9 AM? Asking these questions is what shifts you from merely knowing what happened to truly understanding why.
Pinpointing Your High-Performing Content
One of the most valuable exercises when you analyze a Twitter account is identifying which content formats really click with your audience. Do they love your long, detailed threads, or are they more likely to jump on a quick poll?
- Content Format: Sort your top tweets by their type—video, image, thread, link post, you name it. Is there one format that consistently pulls in the highest engagement rate? That's your goldmine.
- Topic Clusters: What subjects actually get people talking? Try tagging your content by topic to see which ones earn the most replies and reposts.
- Posting Times: Take your best-performing posts and check what time they went live. This is a dead giveaway for when your audience is most active and ready to engage.
Breaking things down this granularly is essential. If you want to get deeper into the numbers, our guide on understanding engagement metrics on Twitter is a great resource for mastering the key indicators. This data also helps you connect with the right people. For example, knowing that Twitter's user base in the US skews toward younger adults might shape your content strategy. You can explore detailed Twitter user statistics to learn more about who you're talking to.
A successful analysis doesn't just produce a report; it produces a refined action plan. The goal is to walk away with a clear list of what to do more of, what to do less of, and what to test next.
Turning Insights into Actionable Growth
Alright, you've crunched the numbers and stared at the charts. Now what? An audit is useless if you don't actually do anything with the data. This is where we move from observation to experimentation and turn those insights into real, tangible growth.
Think of your content strategy as a series of small, controlled experiments. Let's say your audit revealed that short videos posted on weekday mornings are your sweet spot. Don't just take that at face value. Put it to the test.
For one week, double down and post those videos at 9 AM sharp. The next week, shift that time slot to the afternoon and compare the results head-to-head. This is how you confirm your findings and build a strategy on solid ground, not just assumptions.
Fine-Tuning Your Content and Timing
This experimental mindset should apply to everything, especially your core content pillars. If your deep-dive threads on industry news consistently crush the engagement of simple link posts, that's a huge clue. It’s time to lean in. Adjust your content calendar to focus more on crafting high-quality threads and scale back on the formats that aren't pulling their weight.
The secret to sustainable growth on X isn't finding one magic formula. It’s about building a continuous feedback loop: test an idea, measure what happens, and refine your approach based on what the data actually shows you.
For example, maybe your data shows a predictable engagement dip on weekends. Instead of writing off Saturdays and Sundays completely, try testing a different content style. A lighthearted poll or a behind-the-scenes photo might resonate differently with a weekend audience. While general guides on the best time to post on social media give you a great starting point, your own audience data is the ultimate truth serum for fine-tuning your schedule.
By systematically testing and tweaking, you transform insights from your audit into a repeatable process for growth. This is how you ensure your efforts to analyze your Twitter account lead directly to a stronger, more effective presence on the platform.
For more specific tactics on boosting your numbers, check out our complete guide on how to increase Twitter engagement and start building a more connected community.
Common Questions About Twitter Account Analysis

Once you start digging into your Twitter data, you're bound to have some questions. It’s completely normal. Let’s tackle a few of the most common ones I hear from people trying to make sense of their performance.
For a general health check, I recommend looking at your metrics on a monthly basis. This gives you enough data to see real trends without getting lost in the noise of daily ups and downs. But if you’re in the middle of a specific campaign or trying out a new content strategy, switch to weekly check-ins. This lets you react and adjust much faster.
What Is a Good Engagement Rate on Twitter?
Everyone wants to know the magic number. While the general benchmark floats between 0.5% and 1%, what's truly "good" is all about context. Your industry, audience size, and content style all play a huge role.
Honestly, if you're consistently hitting above 1%, you're doing great. But the most important benchmark isn't some universal standard—it's your own past performance and how you stack up against your direct competitors.
Remember, an account with 1,000 highly engaged followers is often more valuable than one with 100,000 passive ones. Focus on steady improvement over chasing an arbitrary number.
What Is the Best Free Analysis Tool?
Beyond X’s built-in Analytics dashboard, X Pro (what we all still call TweetDeck) is an absolute must-have. It's fantastic for real-time monitoring. I use it to keep an eye on key hashtags, conversations, and lists, which gives me the qualitative story behind all the quantitative data.
If you really want to get a handle on the numbers themselves, this complete guide to Twitter performance metrics is the perfect place to start.
The best system combines this kind of regular, real-time monitoring with deeper reviews. This rhythm helps you understand both immediate reactions and long-term strategic performance, giving you a complete picture of your account’s health and where it can grow.
Ready to stop scrolling and start growing? Reply Guy is a Chrome extension that finds high-momentum tweets for you, so you can craft timely replies that boost your impressions and gain followers effortlessly. Get lifetime access with a one-time purchase at https://www.getreplyguy.com.